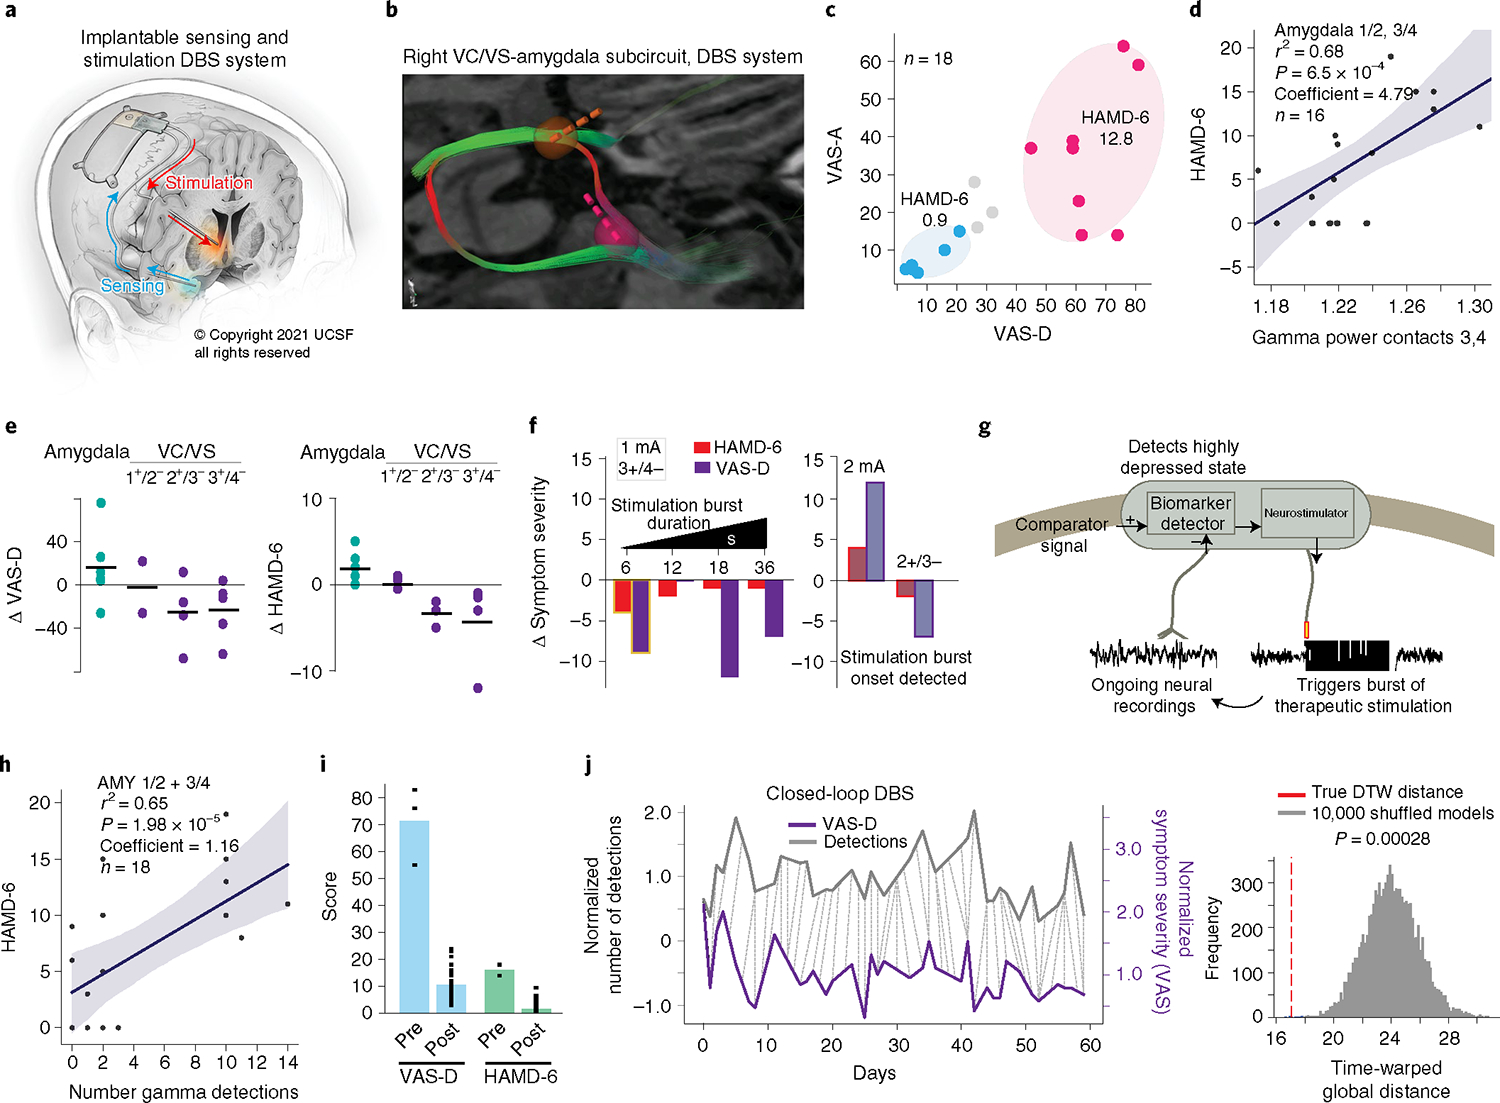
Fig. 2 |. Implementation of closed-loop neuromodulation.

a, Fully implantable DbS system (illustrated by K. X. Probst). b, Reproducibility of targeting showing robust engagement of the stria terminalis and ansa peduncularis. VC/VS lead, yellow; amygdala lead, pink. c, Distribution of symptom severity scores in relation to clusters identified in the mapping study. d, Positive correlation between gamma power in amygdala contacts 1/2 and 3/4 within the 10-min trials and HAMD-6 score. The linear regression model was evaluated using a two-sided F-test and P values were adjusted for multiple comparisons. The linear model fit is presented as the mean ± s.e.m. over n = 16 symptom ratings. e, Reproducibility of clinical effects. Each point represents a stimulation trial (n = 6, 2, 4, 5 for VAS-D; n = 6, 2, 3, 4 for HAMD) at different bipolar configurations across the right VC/VS and amygdala. f, Left: Effect of burst duration on clinical measures. Stimulation parameters: contact 3+/4−, 1 mA, 36 s total stimulation across 15.6 min in 6–36 s intervals. Highlighted condition (6-s burst duration) selected for implementation of closed-loop therapy. Right: Effect of increasing dose (1–2 mA) and changing contacts (3+/4− to 2+/3−) on clinical measures. The faded colors indicate that ON/OFF states were detected by the patient (one trial per condition). g, Schematic of closed-loop control. h, Positive correlation between number of gamma detections by the NeuroPace RNS System within 10-min trials as in d and HAMD-6 score. The linear regression model was evaluated using a two-sided F-test and P values were adjusted for multiple comparisons. The linear model fit is presented as the mean ± s.e.m. over n = 18 gamma detections. i, Symptom severity scores in the week pre- versus postclosed-loop stimulation onset (n = 3, 31 for VAS-D, n = 2, 30 for HAMD-6). j, Relationship between daily mood ratings (purple) and number of daily biomarker detections (gray). The dotted lines indicate the DTW-computed distance between VAS-D scores and daily biomarker detection numbers (left). Significance was assessed by comparing the DTW distance to that computed from 10,000 randomly scrambled biomarker time series (right).
