(
A) Percentage of identical observations between observer–observer pairs. (
B) Percentage of identical observations as a function of the number of behaviors present in a trial. (
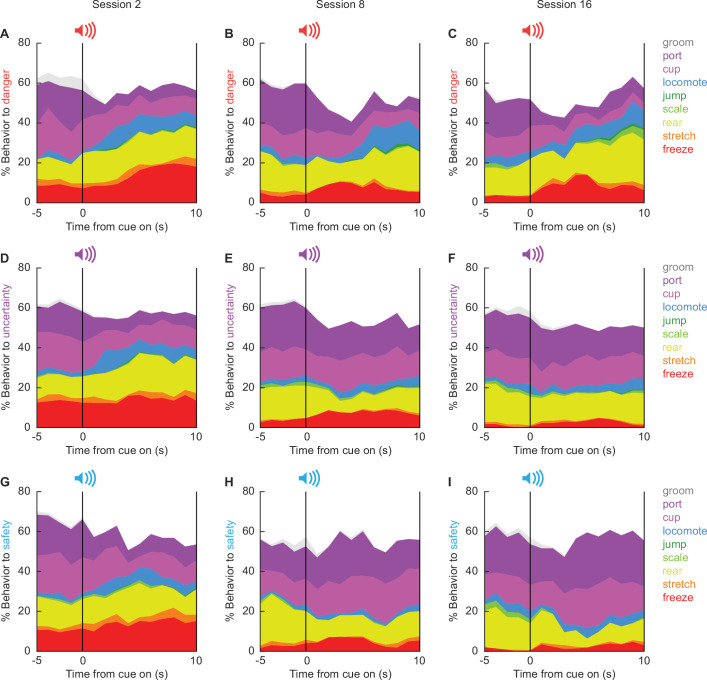
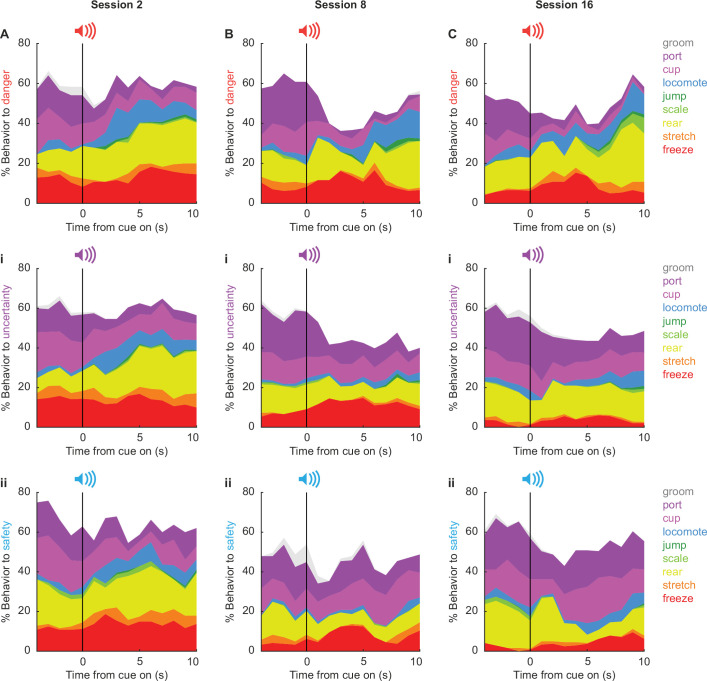
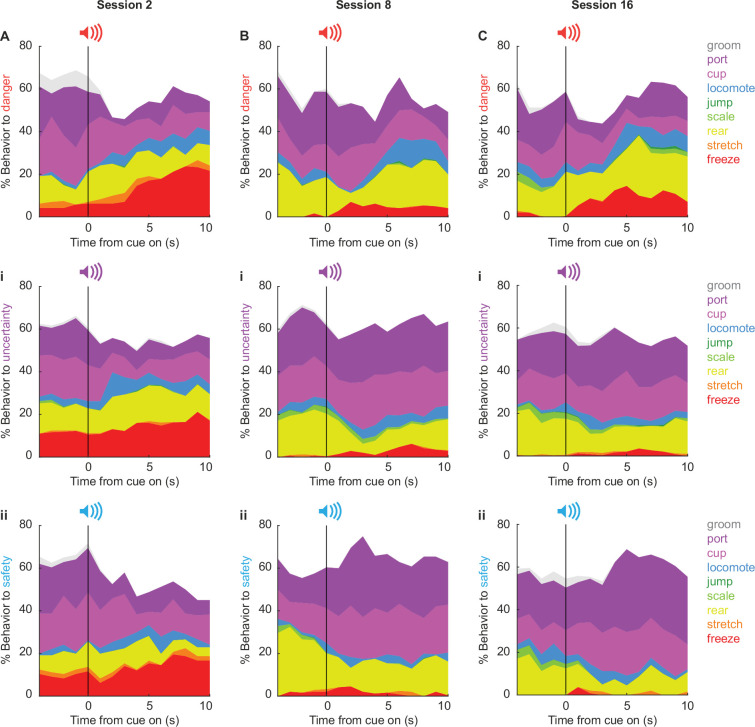
C) Example ethogram from a single uncertainty cue presentation, taken from a female during session 8. Frames were systematically hand scored by five observers blind to rat identity, session number, and trial type (see Materials and methods for hand scoring approach and trial anonymization). A comparison dataset consisting of 12 trials (900 frames) was also scored by each observer. A correlation matrix compared % identical observations for the 900 comparison frames for each observer–observer pair. Mean % identical observation was 82.83%, with a minimum observer–observer pair agreement of 75.89% and a maximum of 90.56%. Previous studies scoring the presence or absence of freezing have reported inter-observer reliability as an
R value: 0.93 (
Parnas et al., 2005), 0.96 (
Pickens et al., 2010), and 0.97 (
Jones and Monfils, 2016). Another study simply reported >95% inter-observer agreement (
Badrinarayan et al., 2012). These values exceed our mean % identical observation. However, we hand scored nine discrete behaviors. We observed a negative relationship between the number of behavior categories present and % identical observations (
R2 = 0.17, p = 2.27 × 10
−6). Mean percent identical observation was 95% when two behavior categories were present, and 92.5% when three behavior categories were present. Even when eight behavior categories were present, a mean percent identical observation of 78% was achieved. Our approach yielded high inter-observer reliability across trials with few and many behavior categories present.


