. 2024 May 21;13:e82497. doi: 10.7554/eLife.82497

Figure 4. Danger-elicited behaviors.

Line graphs show mean ± standard error of the mean (SEM) percent behavior from 5 s prior through 10 s cue presentation for danger (red), uncertainty (purple), and safety (blue) for (A) port, (B) cup, (C) locomote, (D) jumping, and (E) rearing. Bar plots show mean change in behavior from baseline (5 s prior to cue) compared to last 5 s of cue. Individuals represented by black (female) and gray (male) dots.+95% bootstrap confidence interval for danger vs. safety (black), danger vs. baseline (red), or safety vs. baseline (blue) comparison does not contain zero (black).

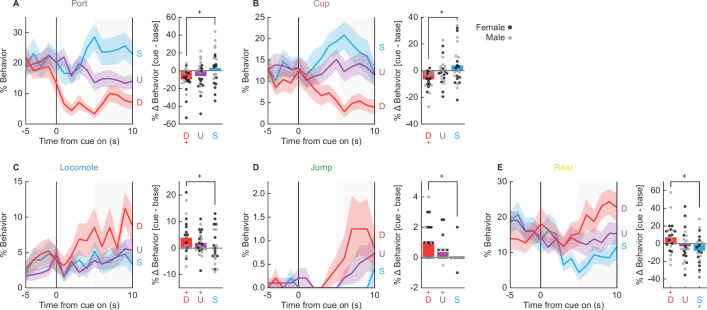
Figure 4.

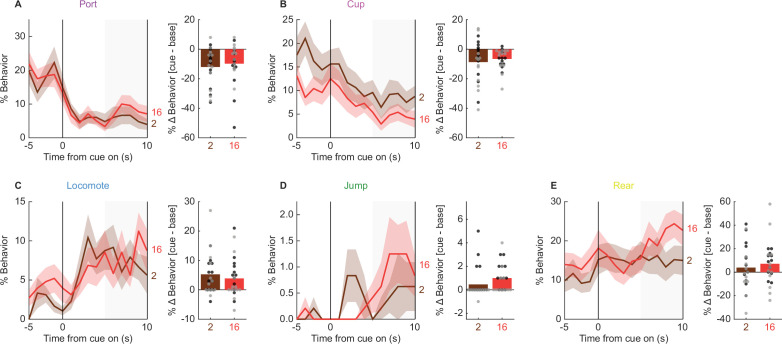
Figure 4—figure supplement 1. Comparison of session 16, danger-specific behaviors during sessions 2 and 16.

Figure 4—figure supplement 1.

Mean ± standard error of the mean (SEM) percent behavior from 5 s prior through 10 s danger presentation is shown for (A) port, (B) cup, (C) locomote, (D) jump, and (E) rear, for sessions 2 (dark brown) and 16 (red). Adjacent plots show mean % change in behavior from baseline to last 5 s of danger presentation for all rats during sessions 2 (dark brown) and 16 (red). Individual data points shown (females, black and males gray).
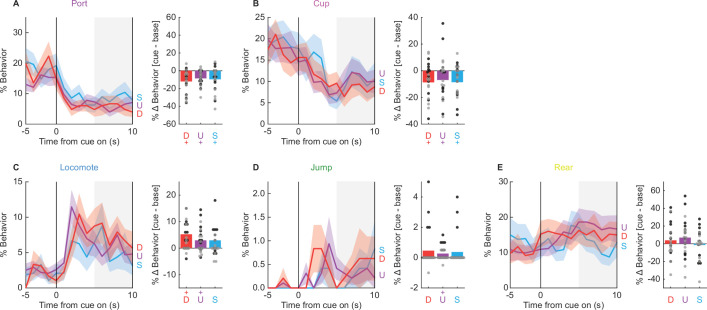
Figure 4—figure supplement 2. Session 16, danger-specific behaviors during session 2.

Figure 4—figure supplement 2.

Mean ± standard error of the mean (SEM) percent behavior from 5 s prior through 10 s cue presentation is shown for (A) port, (B) cup, (C) locomote, (D) jump, and (E) rear, danger (red), uncertainty (purple), and safety (blue). Adjacent plots show mean % change in behavior from baseline to last 5 s of cue presentation for all rats. Individual data points shown (females, black and males, gray). +95% bootstrap confidence interval does not contain zero.