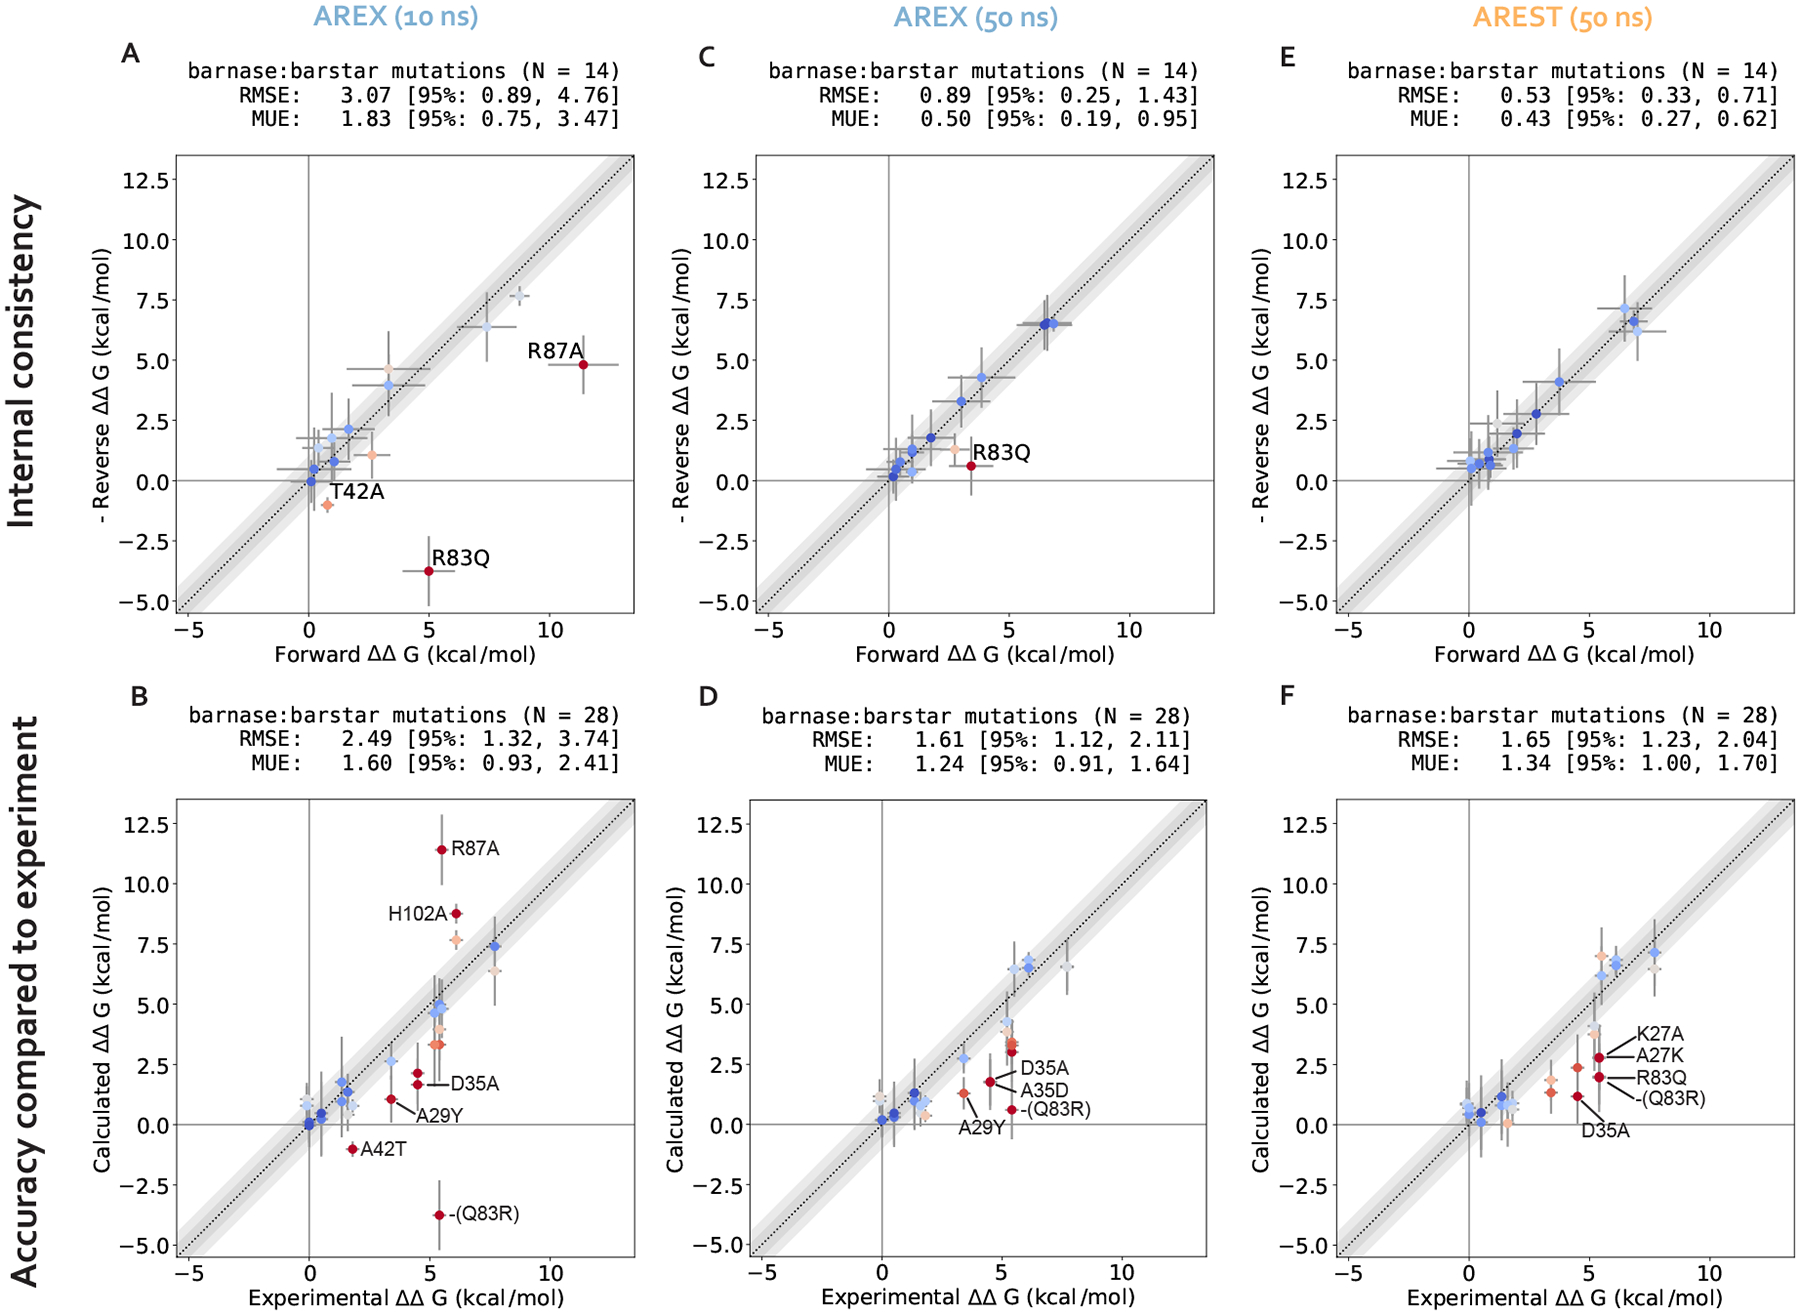
Figure 6. Running long (50 ns/replica) simulations of alchemical replica exchange (AREX) and alchemical replica exchange with solute tempering (AREST) yields improved ΔΔGbinding predictions with respect to 10 ns/replica AREX simulations.

(A) (Negative of the) Reverse versus forward ΔΔGbindings for each barnase:barstar mutation computed from AREX simulations (number of states = 24 and 36 for neutral and charge mutations, respectively and simulation time = 10 ns/replica for each phase). The y = x (black dotted) line represents zero discrepancy between forward and (negative of the) reverse ΔΔGbindings, the dark gray shaded region represents 0.5 kcal/mol discrepancy, and the light gray region represents 1 kcal/mol discrepancy. Data points are colored by how far they are from zero discrepancy (dark blue and red indicate close to and far from zero, respectively). Data points are labeled if the forward and (negative of the) reverse ΔΔGbindings are not within statistical error of each other (i.e., neither the forward nor the negative reverse ΔΔGbinding is within 1 kcal/mol of the 95% Cl for the other ΔΔGbinding). Error bars represent two standard deviations and were computed by bootstrapping the decorrelated reduced potential matrices 200 times. Root mean square error (RMSE) and mean unsigned error (MUE) are shown with 95% confidence intervals obtained from bootstrapping the data 1000 times. (B) Calculated versus experimental ΔΔGbindings for each barnase:barstar mutation computed from AREX simulations (number of states = 24 and 36 for neutral and charge mutations, respectively and simulation time = 10 ns/replica for each phase). The y = x (black dotted) line represents zero discrepancy between calculated and experimental ΔΔGbindings, the dark gray shaded region represents 0.5 kcal/mol discrepancy, and the light gray region represents 1 kcal/mol discrepancy. Data points are labeled if the 95% Cls of the calculated and experimental ΔΔGbindings are not within 1 kcal/mol of each other. For more details on the plot and error bars, refer to the caption for panel A. (C) Same as (A), but using 50 ns/replica AREX simulations for the complex phase and 10 ns/replica AREX simulations for the apo phase instead of 10 ns/replica AREX simulations for both phases. (D) Same as (B), but using 50 ns/replica AREX simulations for the complex phase and 10 ns/replica AREX simulations for the apo phase instead of 10 ns/replica AREX simulations for both phases. (E) Same as (A), but using 50 ns/replica AREST simulations for the complex phase and 10 ns/replica AREX simulations for the apo phase instead of 10 ns/replica AREX simulations for both phases. (F) Same as (B), but using 50 ns/replica AREST simulations for the complex phase and 10 ns/replica AREX simulations for the apo phase instead of 10 ns/replica AREX simulations for both phases.
