Figure 2.

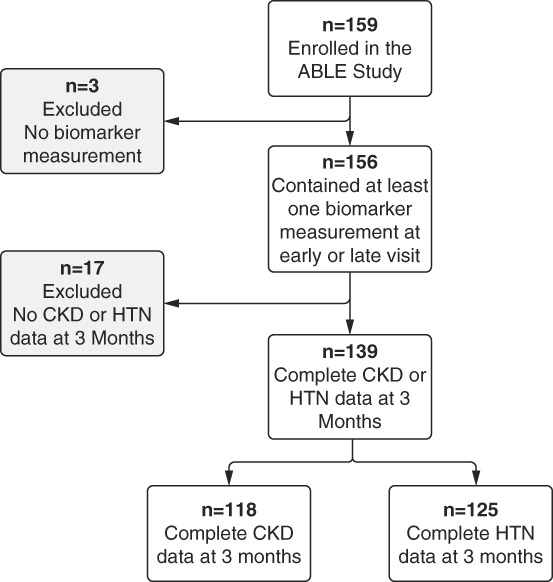
Study flow chart. The flow chart shows the total number of patients recruited into the ABLE Nephrotoxicity study and the cohort used for analysis. Figure was produced with Biorender.

Study flow chart. The flow chart shows the total number of patients recruited into the ABLE Nephrotoxicity study and the cohort used for analysis. Figure was produced with Biorender.