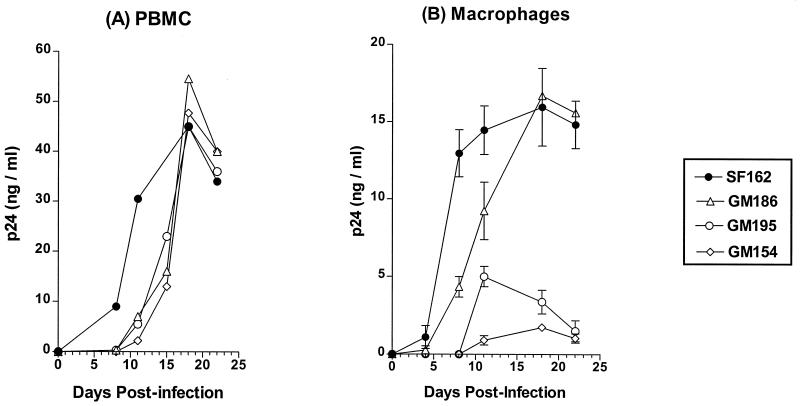
FIG. 3.
Replication in activated human PBMC (A) and primary human macrophages (B). The replication of the mutant viruses was compared to that of the parental SF162 isolate, as described in Materials and Methods. Values indicate the mean p24 concentration from triplicate wells, and the bars indicate the standard deviation from the mean (in the case of PBMC, the standard deviation has been omitted for clarity). One out of three independent experiments is shown.

