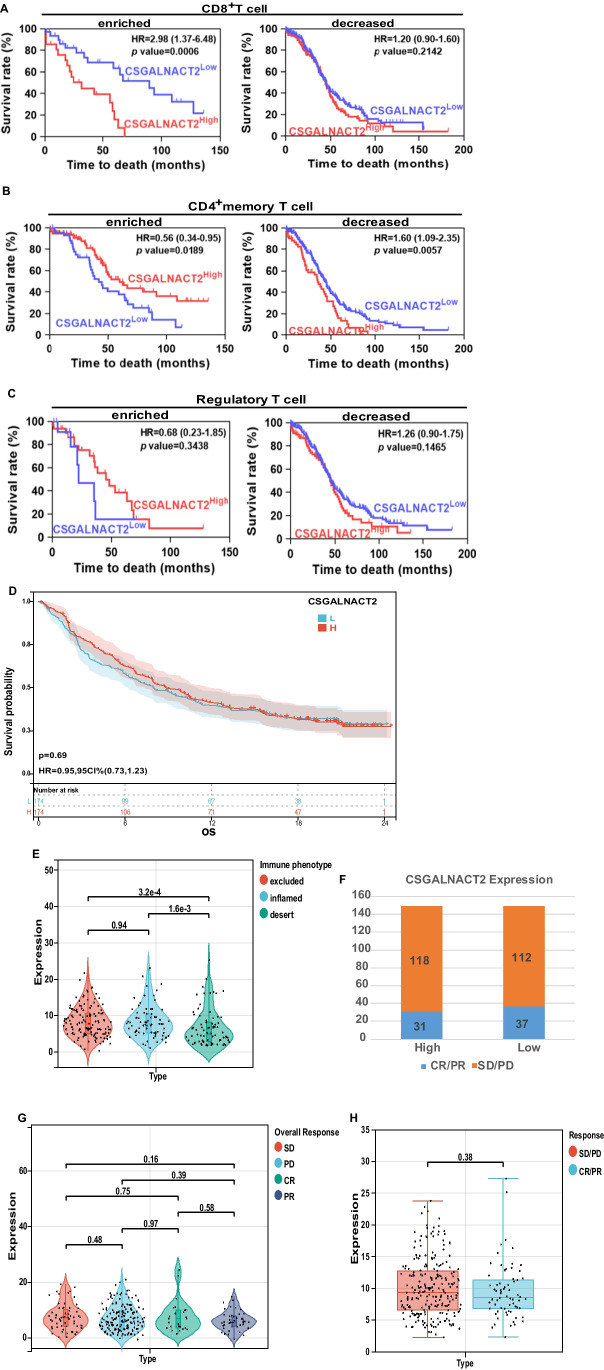
Fig. 6.
Correlation analysis of CSGALNACT2 with immunotherapy and immune cell infiltration. A Kaplan–Meier curves were plotted based on the different groups of CSGALNACT2/CD8 + T cell enriched or decreased, CSGALNACT2/CD4 + memory T cell enriched or decreased, B CSGALNACT2/Regulatory T cell enriched or decreased C in TCGA cohort. D Survival analyses for high (174 cases) and low (174 cases) CSGALNACT2 expression patient groups in the anti-PD-L1 immunotherapy cohort using Kaplan–Meier curves (IMvigor210 cohort). E Differences in CSGALNACT2 among distinct tumor immune phenotypes in the IMvigor210 cohort. The lines in the boxes represented the median value by the Kruskal–Wallis test. F The number of patients with response to PD-L1 blockade immunotherapy in high or low CSGALNACT2 expression groups. SD, stable disease; PD, progressive disease; CR, complete response; PR, partial response. G The distribution of CSGALNACT2 in different anti-PD-L1 clinical response groups. H The correlation of CSGALNACT2 with immunotherapy response, Wilcoxon rank sum was applied for the significance test

