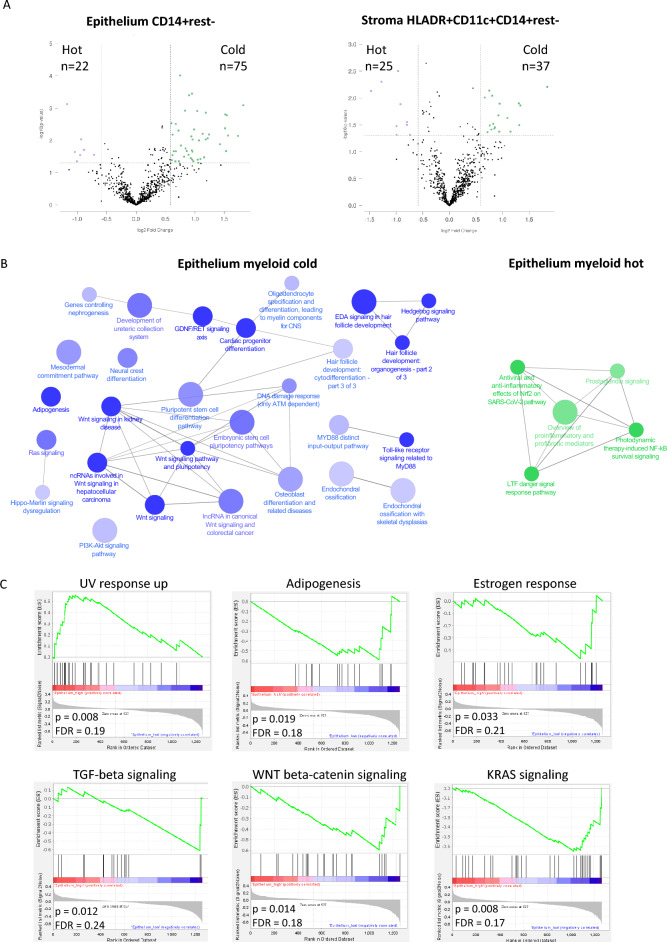
Fig. 4.
Transcriptomic differences between myeloid hot and cold tumors. A Volcano plots of differentially expressed genes (DEGs) between myeloid hot versus cold VSCC lesions (total VSCC n = 77, split by median into hot or cold): epithelial CD14+rest− monocytes (left graph) and stromal HLADR+CD11c+CD14+rest− dendritic cells (right graph). B ClueGo pathway analysis of identified DEGs between epithelial CD14+rest− monocytes hot versus cold VSCC. C Hallmark gene set enrichment analysis (GSEA), showing gene sets enriched in epithelial CD14+rest.− hot versus cold VSCC, selected based on FDR < 0.25 as well as p < 0.05

