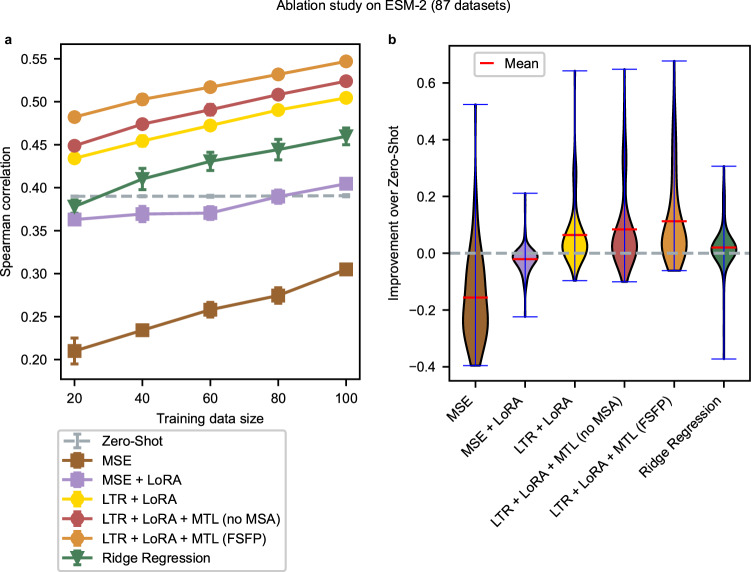
Fig. 2. Ablation study on ESM-2.
a Average performance of each strategy across all datasets in ProteinGym with respect to the training data size, evaluated by Spearman correlation. For each dataset, we randomly pick a small number of (20, 40, 60, 80, and 100) single-site mutants as a training set, with all the rest as a test set. Each dot in the figure is the average test performance of five random data splits, along with the error bar indicating the standard deviation caused by different splits. Two-sided Mann–Whitney U tests are used for comparing the performance of FSFP with all other strategies, and the largest P value among all training sizes is 0.0079. Analogous results measured by NDCG, Pearson correlation, and MAE are shown in Supplementary Fig. 1b–d. b Distribution of the performance improvement in Spearman correlation over zero-shot prediction across all datasets in ProteinGym, with a training size of 40. The performance gain of each dataset is averaged among the five random splits. Source data are provided as a Source Data file.

