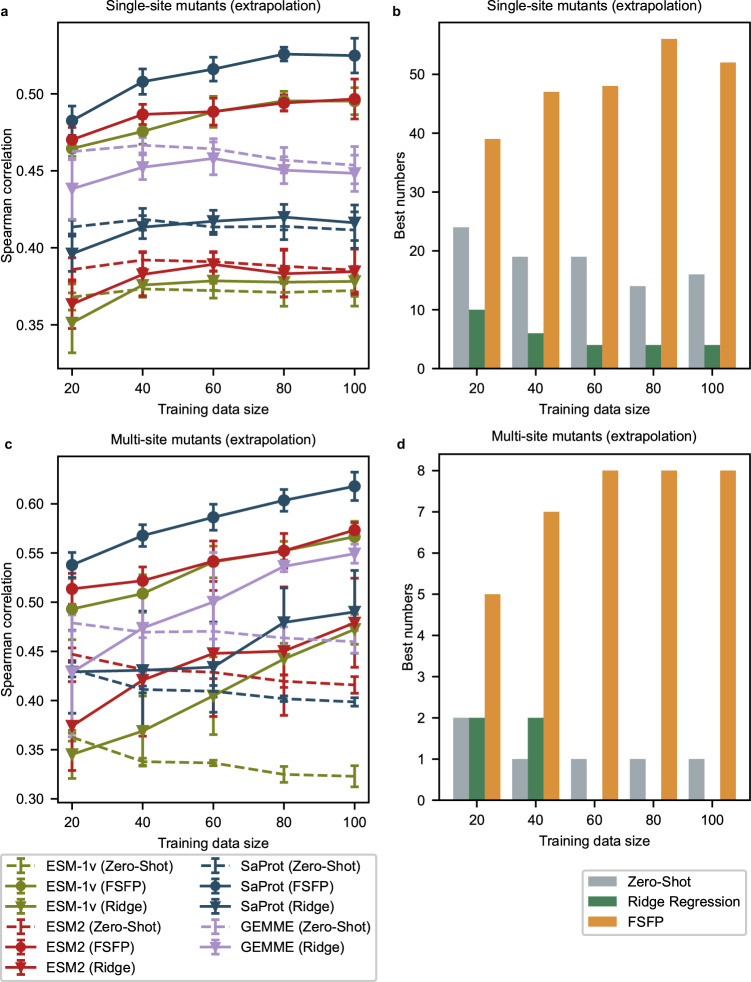
Fig. 4. Extrapolative performance on single-site and multi-site mutants.
a Extrapolating to single-site mutants whose mutated positions do not occur in the training set, evaluated by Spearman correlation. Error bars are centered at average performance and indicate the standard deviation caused by five random splits. SaProt (FSFP) is significantly better than all baselines with the largest P value among all training sizes being 0.016 (two-sided Mann–Whitney U test). Analogous results measured by NDCG are shown in Supplementary Fig. 4a. b Summary of how often the best extrapolative Spearman correlation for single-site mutants on a certain dataset is achieved by a PLM, where the colors represent different strategies applied to the best PLMs. c Extrapolating to multi-site mutants whose individual mutations have no overlap with the mutations in the training data, evaluated by Spearman correlation. Error bars are centered at average performance and indicate the standard deviation caused by five random splits. SaProt (FSFP) is significantly better than all baselines with the largest P value among all training sizes being 0.0079 (two-sided Mann–Whitney U test). Analogous results measured by NDCG are shown in Supplementary Fig. 4b. d Similar to (b) but counted for the best extrapolative performance on multi-site mutants. Source data are provided as a Source Data file.

