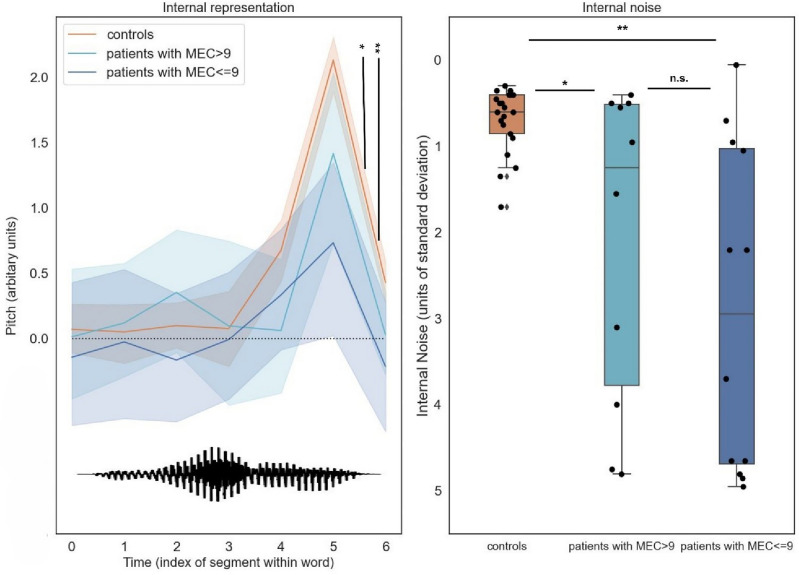
Figure 2.
Patient parameters (internal representations and internal noise) estimated by reverse-correlation separate controls from patients above and below the pathological cut-off on the MEC prosody comprehension scale (9/12). Left: Internal representations of interrogative prosody computed from control group responses exhibited a typical final-rise contour, with a marked increase of pitch at the end of the second syllable. In contrast, patients’ internal representations had both lower amplitude and more variable shape across individuals. The bottom waveform illustrates the shape of the base sound used to generate stimuli (a male-recording of the word vraiment/really). Right: control participants were able to apply these representations remarkably consistently across trials, with internal noise values < 1 standard deviations of stimulus noise. In contrast, patients’ internal noise levels were larger and more variable, and scaled with prosodic difficulties measured by MEC.

