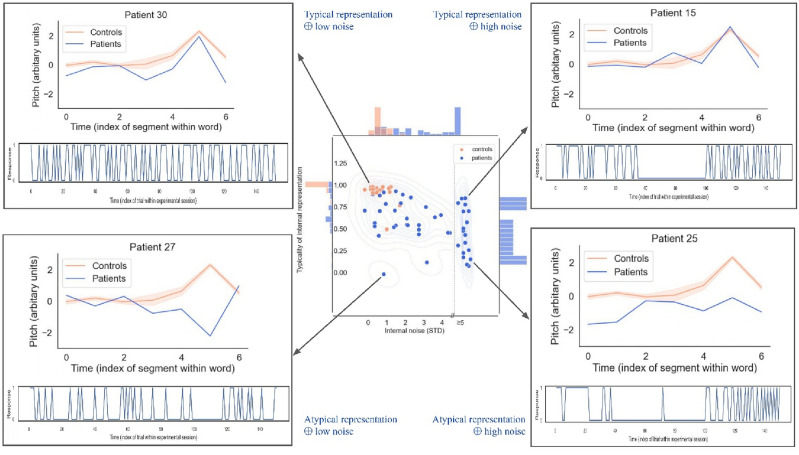
Figure 3.
The representation + noise model captures a rich diversity of sensory/cognitive mechanisms underlying impairments of prosody processing after stroke. Center: Distribution of representation typicality and internal noise for controls and patients (considering all 4 sessions), overlaid with by kernel density estimate. Histograms on the marginal axes show univariate distributions for each variable in the patient group. Corners: Corner boxes show internal representations (top) and behavioral series of responses (bottom) for 4 illustrative patients. Patients in top corners have internal representations (blue) that are similar to controls (orange), but vary in amounts of internal noise (e.g. showing excessive response perseveration; top-right). Patients in bottom corners have atypical representations (blue), but some nevertheless retain healthy levels of internal noise (e.g., being normally consistent in wrongly expecting question phrases to decrease rather than increase in pitch; bottom-left). The estimation of internal noise was limited to the range [0; + 5std]; data points in the upper side of that range may either correspond to true internal noise values, or to larger values for which we could not provide an exact estimate, as illustrated here with a dotted line in the central panel (see Appendix for details).

