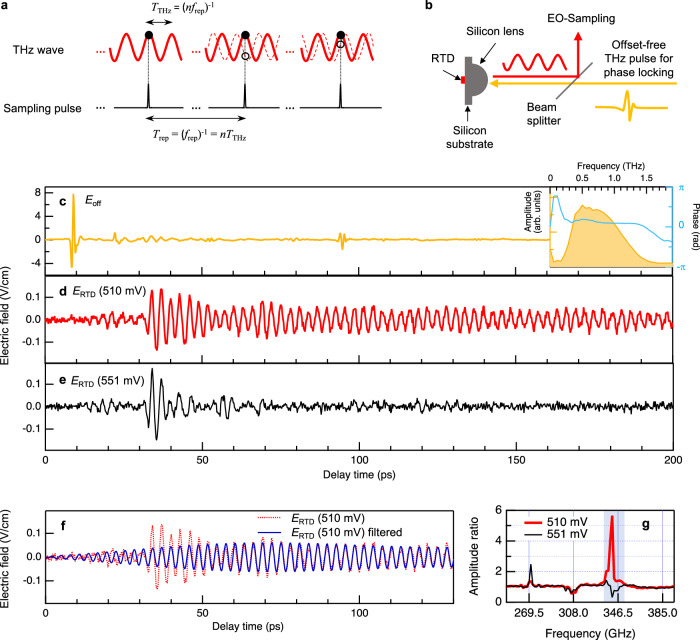
Fig. 1. Phase-resolved time-domain sampling of RTD THz oscillator.
a Principle of optical sampling. THz wave (solid red curve) and sampling pulses are phase-locked. Dashed red curve represents the THz wave from free-running electronic oscillators with phase noise. b Phase-locking of RTD by offset-free THz pulse injection. c Waveform of the injection THz pulse (Eoff). The inset shows the amplitude (orange) and phase (blue) in the frequency-domain calculated from Eoff in the first 18 ps. The time origin was taken at 9 ps (positive peak of the main pulse) for the phase determination based on cosine function. Small-amplitude pulses at 22 ps and 94 ps are due to internal reflections inside the silicon substrate and detection crystal, respectively. d Waveform of the difference signal (ERTD) at 510 mV. Injection THz pulse is nearly perfectly canceled by the double modulation technique. e Waveform of the difference signal at 551 mV which is just outside of the oscillation region. f Waveform of the RTD emission component (blue curve) at 510 mV obtained by frequency filtering. g Fourier amplitude ratio between bias voltage on and off (red: 510 mV, black: 551 mV). The vertical grid lines are drawn at the integer multiples of 38.5 GHz. The frequency resolution is 1.67 GHz. The amplitude ratio is almost unity in other frequency region. Only the spectral components in the blue shaded region are used to calculate the blue curve in d.

