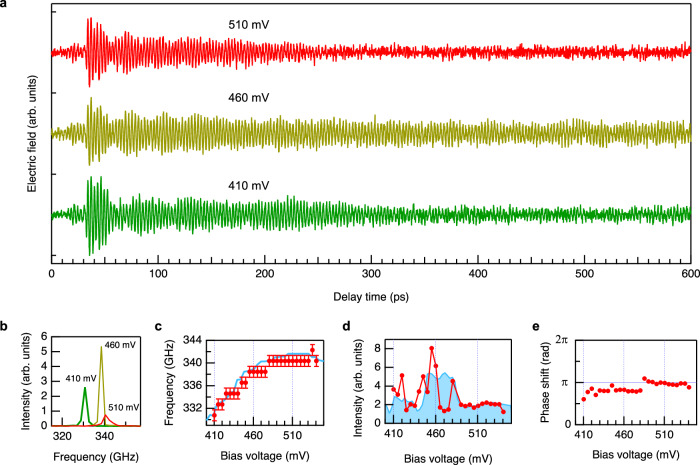
Fig. 2. Bias voltage dependence.
a Typical waveforms and (b) power spectra of the differential signals at three different bias voltages. To exclude the effect of the RTD reflectivity change, we used time-domain data after 80 ps to obtain the power spectra. (c) Oscillation frequencies determined from the peak position of the power spectra (red circles). The error bars represent frequency resolution (1.92 GHz). Blue curve represents the oscillation frequency in the free-running state determined by conventional heterodyne down-conversion method52. d Output intensity determined from the peak area of the power spectrum (red circles). Blue curve is the output intensity in the free-running state measured with a square law detector (Fermi-level managed barrier diode53). The data point at 485 mV is omitted due to the different situation of the phase-locking, as shown in Fig. 3. e Phase shift determined from the oscillation phase of the time-domain waveform at each bias voltage.

