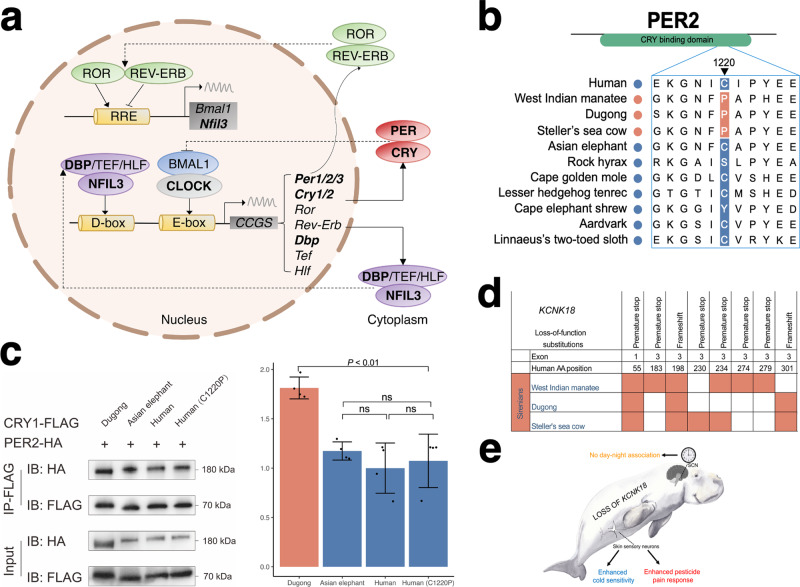
Fig. 4. Multiple gene changes may underlie the circadian activity of sirenians.
a Diagram of core circadian clock network. Genes with evolutionary changes in sirenians are bolded. D-box and E-box denote promoter elements found upstream of clock-controlled genes regulated by the transcription factors NFIL3 and CLOCK. b Alignment showing an amino acid substitution in the CRY binding domain of sirenian PER2. A sirenian-specific proline at residue 1220 is shown in red shading. c Left, a representative co-immunoprecipitation assay reveals a stronger binding ability of dugong PER2 with its CRY1 compared to Asian elephant and human forms. Human C1220P denotes human PER2 mutated to match dugong residue 1220. Numbers on the right side of the gels represent molecular weight marker locations (values in kDa). Full images of western blots in Fig. S5. Right, bar graph showing ImageJ densitometry of western blot from four independent experiments with single measurements, presented as mean arbitrary density units ± S.D. relative to human, while dots represent individual data points per experiment. One-sided ANOVA with Tukey’s multiple comparisons test (ns denotes not significant, a P value > 0.05). The exact P values were dugong-Asian elephant, 3.31 × 10⁻³; dugong-human, 4.48 × 10⁻⁴; dugong-human (C1220P), 1.02 × 10⁻³; Asian elephant-human, 0.62; Asian elephant-human (C1220P), 0.89; human–human (C1220P), 0.95. d Overview of inactivating substitutions in sirenian KCNK18. Colored cells indicate substitutions. e Illustration of anatomical sites where KCNK18 plays important roles and potential functional outcomes of its loss in sirenians. SCN denotes the hypothalamic suprachiasmatic nucleus. Image of dugong courtesy of Liudmila Kopecka/Shutterstock.com.

