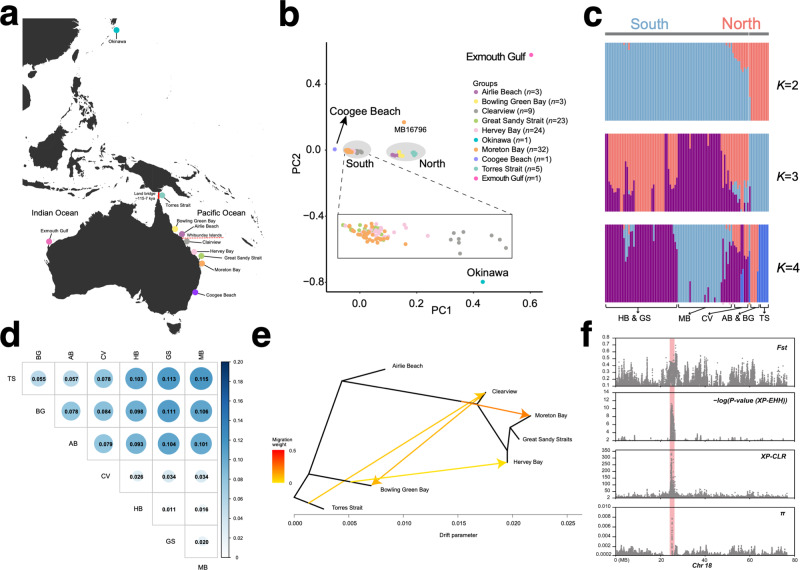
Fig. 5. Evidence of population structure by dugongs on the Australian east coast.
a Map indicating approximate sites of origin of re-sequenced dugongs. The red continuous line indicates a historical Torres Strait land border (115–7 kya); the dotted red line, a potential ecological barrier at or near the Whitsunday Islands on the Great Barrier Reef. Geographical locations are approximate. b Principal component (PC) analysis of the dugong individuals in (a). The gray highlighting shows clustering consistent with geographic locations south and north of the Whitsunday Islands also reported by ref. 60. c structure (ADMIXTURE) plots demonstrate substantial structure, supporting a break between population north and south of the Whitsunday Islands. Genetic structure inferred by varying the ancestry components (K) shown. d Pairwise population differentiation index (FST) differences between northern (TS, BG, and AB) and southern (CV, HB, GS, and MB) population groups. Calculated in non-overlapping 10-kb sliding windows with 2-kb step sizes. e Gene flow among populations detected by TreeMix. A Maximum likelihood tree was inferred with four migration events. Terminal nodes are labeled by locality (see a). Arrows represent gene flow, and heat map colors reflect the intensity of gene flow, from low (yellow) to high (red). f A ~ 2 Mb selective sweep region on chromosome 18 identified by comparing population groups north and south of the Whitsunday Islands. Population differentiation (FST), normalized XP-EHH, XP-CLR, and relative nucleotide diversity (π) are plotted. The −log(P value(XP-EHH)) is the log10 of a two-sided P value for testing the null hypothesis that no selection occurred, with a value ≥ 5 equivalent to a P value of 0.00001. Note the positive values, indicating selection acting on the northern dugong population.

