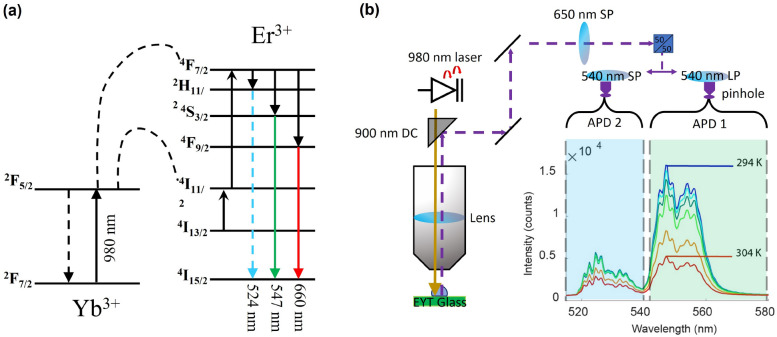
Figure 1.
(a) The energy level diagram for Er and Yb, where Yb acts as a sensitizer in the upconversion energy transfer process to the Er I level. The upconversion process upon excitation at 980 nm yields green and red fluorescence of Er. The two green fluorescence bands at 524 and 547 nm are thermally coupled and hence their intensity ratio is temperature dependent. (b) A schematic of the confocal scanning microscopy setup used to measure the green fluorescence ratio with high temporal and spatial resolution. Pump light from the 980 nm laser is filtered via a 900 nm dichroic mirror (DC) where fluorescence from the EYT glass is sent through a series of filters. The total output is first filtered with a 650 nm shortpass filter, and then split, whereby each beam is filtered via a 540 nm shortpass (SP) or 540 nm Longpass (LP) filter, respectively, to measure separately the intensity for each green band with an avalanche photodiode detector (APD).

