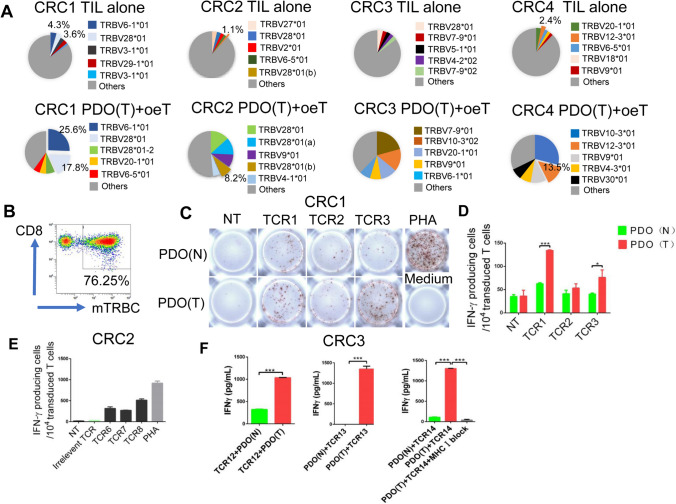
Fig. 5.
Functional verification of TCR-Ts. A Pie charts showing the distribution of a given TCR beta-chains of CD8+CD137+ T cells stimulated with tumor organoids. B PBLs form healthy donors were transduced with the chimeric TCR and flow sorted by anti-murine TCR-β chain constant region antibody. C IFN-γ ELISPOT analysis on TCR-T cells that were exposed to autologous tumor organoids or normal organoids in CRC1. NT: no transfection. D Quantification of organoid induced IFN-γ production by TCR-T cells co-cultured with autologous tumor organoids or normal organoids in CRC1. E Quantification of organoid induced IFN-γ production by TCR-T cells co-cultured with autologous tumor organoids in CRC2. F ELISA analysis the IFN-γ secretion by TCR-T cells after co-cultured with autologous tumor organoids or normal organoids for 24 h in CRC3. PDO (N): patient-derived normal organoids, PDO (T): patient-derived tumor organoids

