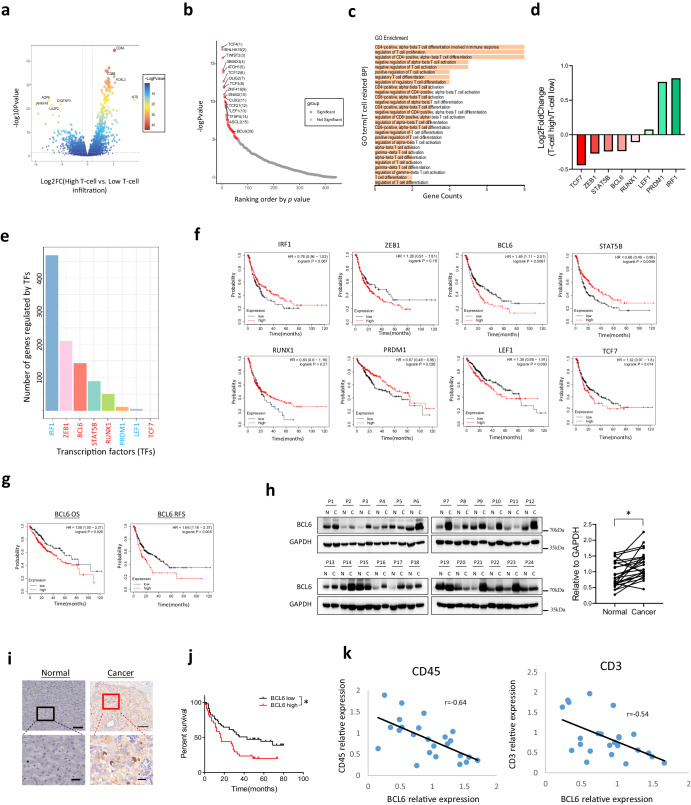
Fig. 1. BCL6 expression is upregulated in HCC cancer tissue and is correlated with poor clinical outcome.
a Volcano plot for differentially expressed genes between T-cell high infiltration group and T-cell low infiltration group. b Transcription factors ranked by p value. c GO_BP pathway analysis for the TFs. d Fold change of the eight candidate TFs between T-high and T-low groups involved in T cell function as shown in (c). e Number of genes regulated by the 8 candidate TFs within the differentially expressed genes between T-high and T-low groups. f Progression-free survival data for the 8 TFs. g Overall survival and Recurrence-free survival for BCL6. h Western blot and quantification for BCL6 in HCC cancer tissue and the adjacent normal tissue, N: adjacent normal tissue, C: HCC cancer tissue, P: patient. i Immunohistochemistry for BCL6 in HCC cancer and adjacent normal tissue. j Survival curve based on the HCC samples from immunohistochemistry. k Correlation of CD45, CD3 expression with BCL6 expression based on western blotting for HCC patient samples. * p < 0.05; scale for the upper panel of immunohistochemistry is 100 µm, lower panel is 20 µm.

