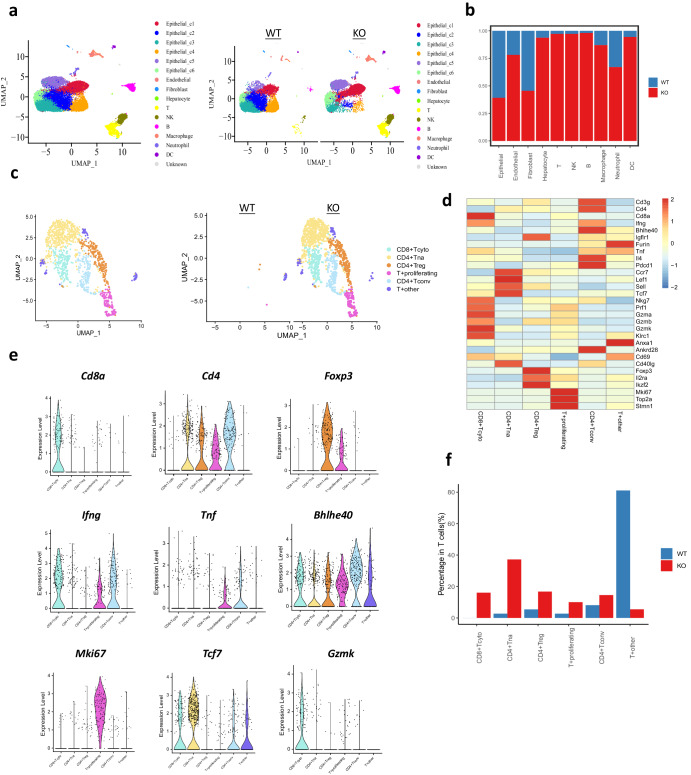
Fig. 3. Single-cell RNA sequencing reveals that BCL6 turned “cold” tumor into “hot” tumor.
a UMAP clusters for wild type and Bcl6 knockout H22 derived tumor. b Percentage of each cell population derived from H22 WT and Bcl6 KO tumors. c UMAP for T cell re-clustering, T+proliferating: proliferating T cells, T+other: undefined other T cells. d Heatmap for marker gene expression for T cell clusters. e Violin plot of representative marker gene expression for each T cell cluster. f T cell subpopulation distribution for WT and KO groups.

