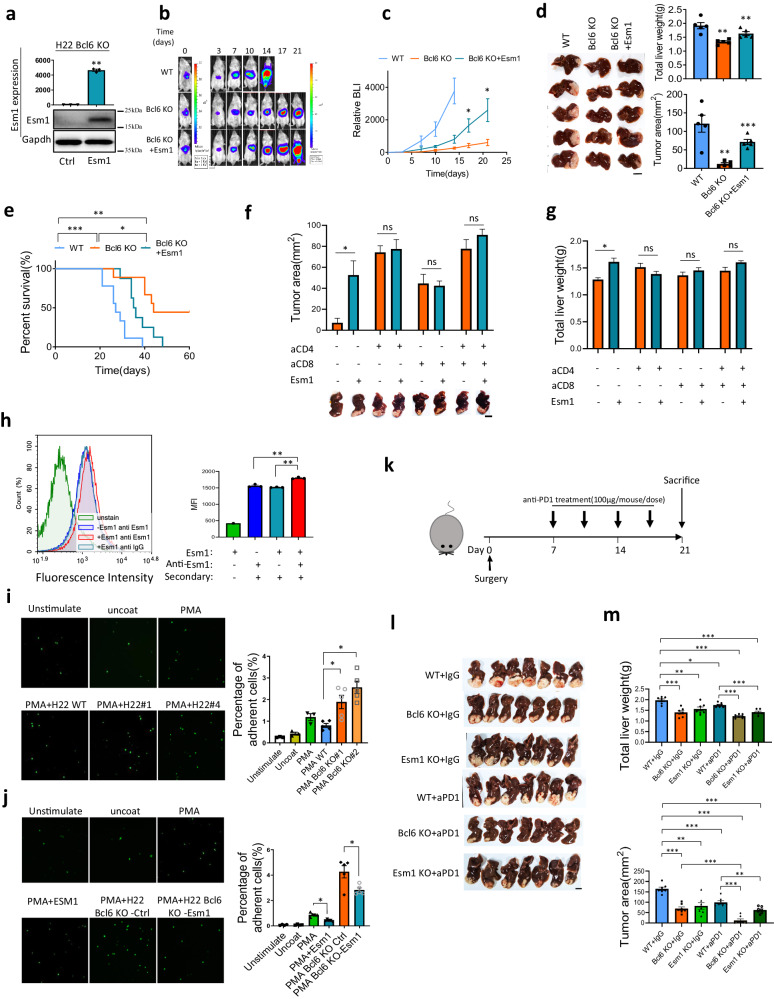
Fig. 7. ESM1 suppresses T cell activation possibly through inhibiting T cell ICAM-1/LFA-1 co-stimulation pathway.
a qPCR and western blot for Esm1 overexpression efficiency, n = 3 for qPCR quantification. b In vivo imaging for H22 WT, Bcl6 KO and Bcl6 KO+Esm1 overexpression. c H22 derived liver cancer growth curve based on in vivo imaging data, n = 5 per group. d H22 derived liver tumor image from IVS experiment and quantification of liver weight as well as tumor area, n = 5 per group. e Survival curve for H22 WT, Bcl6 KO and Bcl6 KO+Esm1 overexpression, n = 10 per group. Tumor images and tumor area (f) as well as total liver weight (g) quantification for H22 Bcl6 KO with or without overexpression of Esm1 at 3 weeks post-surgery (aCD4:anti-CD4, aCD8:anti-CD8). h Flow cytometry indicated that Esm1 binds directly to CD4+T cell surface, n = 3 per group for MFI quantification. i ICAM-1 adhesion experiments indicated that condition medium from H22 Bcl6 KO enhanced CD4+T cell adhesion to ICAM-1, unstimulated: CD4+T cells without activation with PMA, PMA WT: PMA activated T cells treated with H22 wild type condition medium, PMA Bcl6 KO#1: PMA activated CD4+T cells treated with H22 Bcl6 KO#1 condition medium, PMA Bcl6 KO#2: PMA activated CD4+T cells treated with H22 Bcl6 KO#2 condition medium, n = 3 per group. j Esm1 abolished Bcl6 KO enhanced CD4+T cells adhesion to ICAM-1, PMA+Esm1: PMA activated CD4+T cells were treated with Esm1 recombinant protein, n = 3 per group. k Schematic graph for the in vivo experiment. Liver images (l) and quantification of tumor area as well as liver weight (m) for the anti-PD-1 or IgG treated mice (aPD1: anti-PD1), n = 7 per group. *p < 0.05, **p < 0.01, ***p < 0.001, ns: not significant, tumor image scale: 10 mm.

