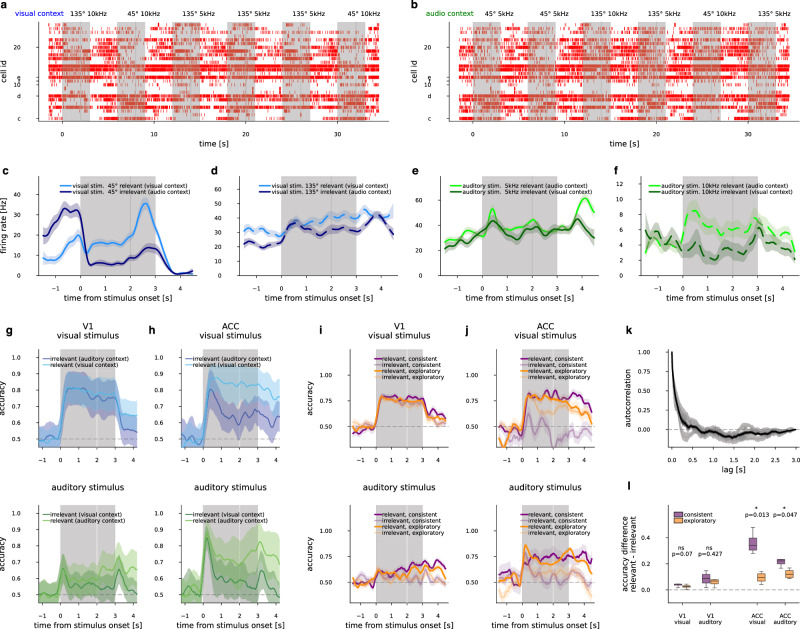
Fig. 2. Suppression of context-irrelevant stimuli.
a Spikes recorded from the ACC of an example animal during six trials (gray shaded areas), with various combinations of visual and auditory stimuli during the visual context. Cells are ordered by recording depth, cells labeled with letters c–f correspond to (c–f). b as (a), but from the auditory context. c Smoothed (300 ms window) mean firing rate of an example ACC cell (‘c’), sensitive to visual “go” stimulus from visual “go” trials in the visually relevant (light blue) and irrelevant (dark blue) contexts, with shading indicating 1 s.e.m. d As in (c), but for an example neuron “d”, sensitive to visual “no-go” stimulus from visual “no-go” trials. e, f As (c, d), but for neurons sensitive to auditory stimulus in audio-varied trials. g Visual (top) and auditory (bottom) stimulus decoding accuracies smoothed (300 ms window) in V1 along the course of trials in the relevant (light color) and irrelevant contexts (dark colors). Mean s.e.m. of n = 8 animals, with s.e.m. plus across animal mean of CV s.e.m. values. h Same as (g), but decoding performed in ACC (n = 4 animals). i Visual (top) and auditory (bottom) stimulus decoding accuracies (n = 8 animals), as in (g), in the relevant (saturated colors) and irrelevant (faint colors) contexts for consistent (purple) and exploratory (orange) trials separately. j As (i), but in ACC (n = 4 animals). k Autocorrelation of decoder accuracies over time points, mean and s.e.m. of 8 conditions based on stimulus, relevance and consistence per mice (light gray lines and bands), and mean over mice and all conditions (black line and band). l Difference of decoding accuracies between relevant and irrelevant trials for V1 (left four boxplots, n = 8), and ACC (right four boxplots, n = 4). Distributions are calculated for 4 block-averaged time points in the 0.6–3 s time interval. Significance of the difference is displayed with two-sided t test P value estimates and confidence levels, boxplots feature the median, boxes at 25–75 percentiles, and whiskers extend to the minimum and maximum.

