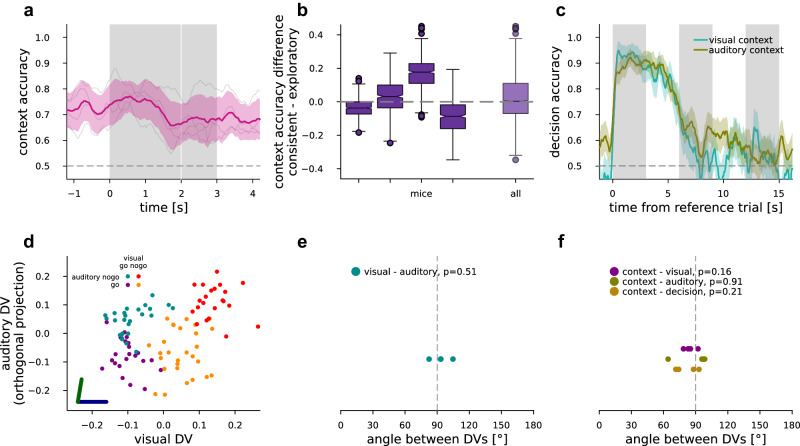
Fig. 3. Context inference, representation geometry.
a CV context accuracy in ACC for individual mice (gray faint lines) and mean and s.e.m. over mice (n = 4, magenta). b Context accuracy difference decoded from consistent over exploratory trials for each mouse individually (left) and the distribution for all time points for all mice (right, n = 4). Boxplots feature the median, notches at 95% C.I. for median, boxes at 25–75 percentiles, whiskers extend to 1.5 times the 25–75 percentile range. c Decoding decision from ACC neurons of an example mouse in the reference (leftmost gray vertical bar), and then two subsequent trials (all other gray vertical bars) within the sequence for each of visual (turquoise) and auditory (okker) contexts. Mean (lines) and s.e.m. (bands) over CV folds. d Population responses averaged over the first 0.5 s of stimulus presentation projected on the DV subspace in individual trials (dots), where colors correspond to visual and auditory stimulus pairing. Dark blue and dark green lines denote the DV directions of visual and auditory decoders, respectively. The horizontal axis is parallel to the visual DV, while the vertical axis represents the maximal projection of the auditory DV orthogonal to the visual DV. e Angle between the visual and auditory DVs in ACC for each animal (cyan dots, n = 4), mean of the first 0.5 s of stimulus presentation, P value of two-sided t test for mean over mice differing from 90°. f Same as (e), but between context and visual, auditory, or decision, respectively (purple, olive, light brown).

