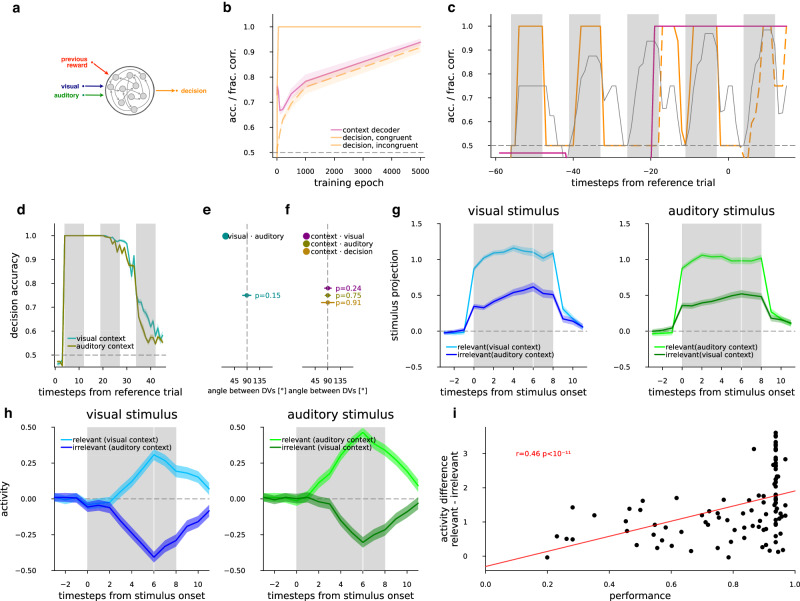
Fig. 4. Set-shifting task in RNNs.
a Schematics of the RNN model ht = f(at, vt, rt-1, ht) and dt = f(ht) at the time resolution of trials (index t, see within-trial sequence equations in “Methods”), where the decision is a map to the decision space of “go” and “no-go”, and is a function of the hidden state vector. The update to the state vector depends on the current visual and auditory stimuli, the previous hidden state, and the reward. Stimuli and reward were switched on and off at a fine time resolution with pulse envelopes as described in Fig. 1b. Note that reward during and after a trial depended on the preceding decision, which resulted in that prior to any decision made only the previous trial was presented (hence the label “previous reward”). b RNN performance (fraction-correct), and quality of the learned representation (context decoder accuracy) as the training of the RNN progresses (epochs). Average (lines) and s.e.m. (bands) of 20 RNNs for context accuracy decoded from hidden units (magenta), and fraction of correct responses (orange) in congruent (solid line) and incongruent (dashed line) trials over learning epochs. c Evolution of the decision signal and the task context when a trained example RNN is performing a sequence of five trials. Decision fraction-correct over all sequences (thin gray). Decision fraction-correct (orange) and context accuracy (magenta), for sequences with an example congruence pattern (c-c-i-c-i, where c congruent and i incongruent trials are indicated on the orange line by solid and dashed style, respectively, as in (b)). Vertical gray bars indicate stimulus presentations. d Decoding decision from hidden units of an example RNN in the reference (leftmost gray vertical bar), and then two subsequent trials (all other gray vertical bars) within the sequence for each of visual (turquoise) and auditory (brown) contexts. e Mean (dot) and 2 standard deviations (not s.e.m., horizontal lines) of the angle between the visual and auditory DVs over the RNN models (cyan dot, n = 88 with performance >0.9), at the first time point of stimulus presentation, P value of two-sided t test for mean over models differing from 90°. f Same as (e), but between context and visual (purple), auditory (olive), or decision (light brown). g Activity from the two contexts projected onto the stimulus (visual: left, blue, auditory: right, green) input weights (equivalent to stimulus decoder DV), go and no-go trials separately, then averaged, mean (lines) and s.e.m. (bands) over models (n = 88 with performance >0.9). Stimuli are separately trial-averaged when they are in their relevant (light colors) and irrelevant (dark colors) context. h visual (left, blue) and auditory (right, green) stimuli when they are relevant in their respective context (light colors), or irrelevant in the opposite context (dark colors), responses of the n = 2 (“go” and “no-go”) hidden neurons projecting to outputs with strongest weights, combined, mean and s.e.m. from n = 88 RNN models. i Regression between performance of a model on all trial types (horizontal axis) and difference between activities in relevant and irrelevant context for all stimuli (vertical axis) combined from (e) for n = 100 RNN models.

