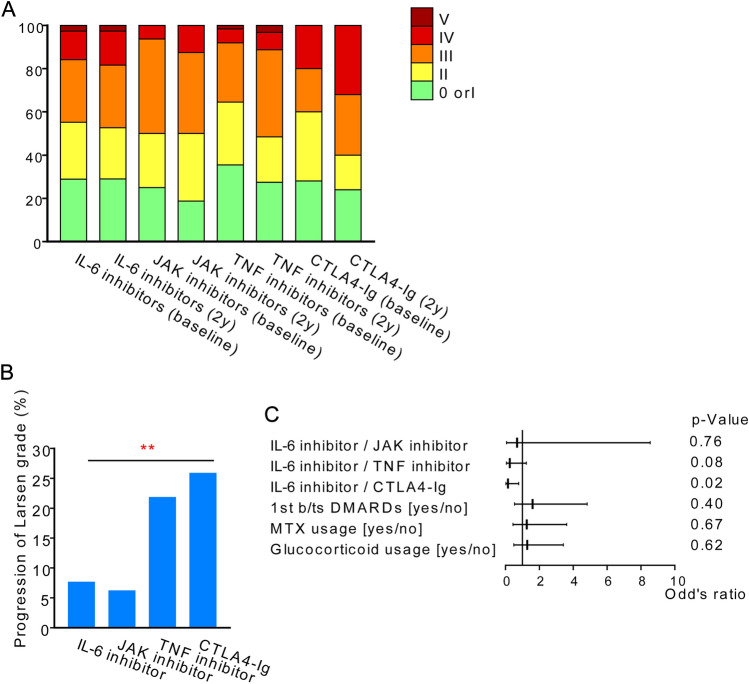
Figure 5.
Radiographic evaluation of the knee. (a) X-ray image of the knee at baseline and two years, assessed by the Larsen grade. (b) Percentage of patients with progression in Larsen grade on X-rays from baseline to two years, excluding progression from grade 0 to I. **; p < 0.01 by Cochran-Armitage trend test. (c) Factors contributing to the progression of Larsen grade on X-rays from baseline to two years, by multivariate logistic regression analysis.

