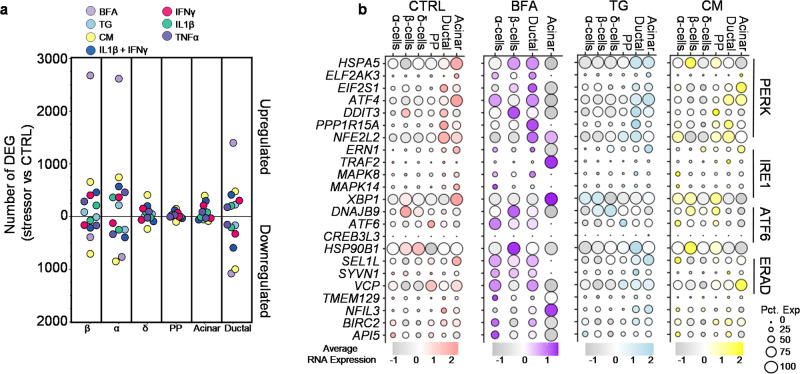
Fig. 2. Variable UPR regulation of stress response.
a Plot of differentially expressed genes (DEG) stressor vs. CTRL in endocrine and exocrine cell types. Above the zero are the number of upregulated genes and below the zero is the number of down-regulated genes. b Average RNA expression of known genes associated with the unfolded protein response (UPR) or ERAD under different stressors and across cell types. Circle size indicates the percent of cells expressing the gene. Source data are provided as a Source Data file.

