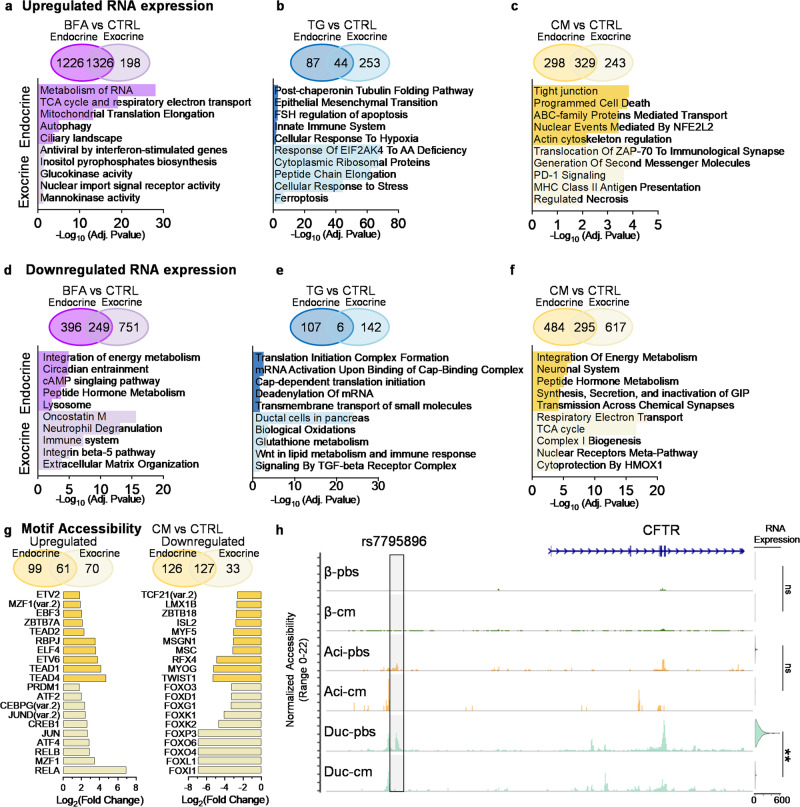
Fig. 3. Tissue-specific differences in response to stress.
a–f Differential gene expression of stressor vs control. Compared endocrine (β-, α-, δ-, PP-cells) vs exocrine (Ductal and Acinar) in Venn diagram. Below the Venn diagram is a bar graph using EnrichR analysis. The top 5 pathways are specific to endocrine, and the bottom 5 are specific to exocrine, (a) upregulated genes in BFA vs CTRL, (b) upregulated genes in TG vs CTRL, (c) upregulated genes in CM vs CTRL, (d) downregulated genes in BFA vs CTRL, (e) downregulated genes in TG vs CTRL, and (f) downregulated genes in CM vs CTRL. DEG cutoff was >0.25 Log2(fold change) for upregulated or < −0.25 Log2(fold change) for downregulated and <0.05 adjusted P-value. EnrichR uses the Benjamini-Hochberg method to correct for multiple hypotheses testing. g Motif accessibility of CM treated cells vs CTRL. Venn diagram compares endocrine (β-, α-, δ-, PP-cells) vs Exocrine (Ductal and Acinar). The left Venn diagram and bar graph are upregulated motif accessibility, and the right is downregulated. The bar graph shows the Log2(fold change) of motifs specific to endocrine (top 10) or exocrine (bottom 10). h Coverage plot of CFTR accessibility and violin plot of RNA expression across endocrine and exocrine cell types. Adjusted P-value **P = 3.11 × 10⁻³¹ or ns for non-significant. Statistical significance was determined by a two-sided Wilcoxon rank sum test. Highlighted is risk variant rs7795896. Source data are provided as a Source Data file.

