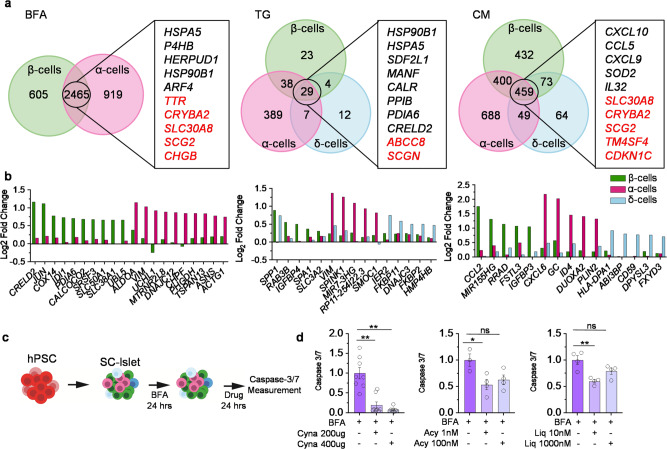
Fig. 4. Endocrine cell-type specific regulation of stress response.
a Venn Diagram of differentially expressed genes across β-, α-, and δ-cells. A list of genes that are shared across cell types, black is upregulated and red is downregulated genes. b Bar graph indicating Log2(fold change) of cell-type specific gene regulation under stress conditions. c Stem cell-derived islets (SC-islets) treated with BFA for 24 h then the addition of a compound for 24 h. d Caspase 3/7 of SC islets with Cynaropicrin (Cyna) (n = 8, P = 0.0001), Acyclovir (Acy) (BFA, n = 3; Acy 1 nM, n = 4, P = 0.024) or Liquitirin (Liq) (n = 4, P = 0.0026). P-values were calculated by Dunnett’s multiple comparison test. *P < 0.05, **P < 0.01 and error bar represent the s.e.m. Source data are provided as a Source Data file.

