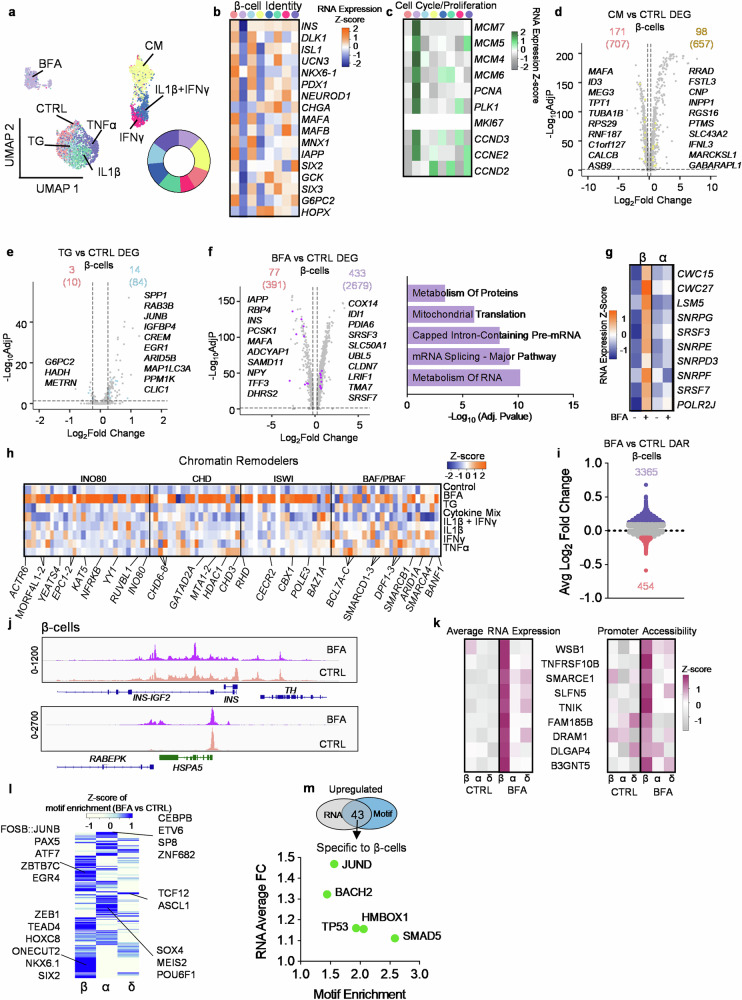
Fig. 6. Stress-induced heterogeneity in the pancreatic β-cells.
a UMAP of only β-cells, circle is the proportion of stressors within the β-cell population (n = 4473). b Average RNA expression of known β-cell genes across stressors. c Heatmap of gene expression associated with cell cycle/ proliferation. d–f, Volcano plots of stressor vs CTRL. d CM vs CTRL, (e) TG vs CTRL, and (f) BFA vs CTRL. The top number is the number of genes specific to β-cells when compared to α-, δ-, PP, acinar, and ductal while the number in the parenthesis is the total number when FindMarkers is conducted. The parameters for genes were genes with a Log2(fold change) >0.25 (upregulated) or Log2(fold change) < −0.25 (downregulated) and adjusted p-value < 0.05. Statistical significance was determined by a two-sided Wilcoxon rank sum test. EnrichR was used for pathway analysis. g Average RNA expression of 10 genes associated with metabolism from (f). h Heatmap of average RNA expression of genes associated with chromatin remodelers across stressors in β-cells. i Differentially accessible regions in β-cells between BFA (top) and CTRL (bottom). j Comparing chromatin peaks near INS, REBEPK, and HSPA5 in β-cells across BFA and CTRL. k Heatmap comparing β-cell-specific genes across cell types, stressors, and promoter accessibility. l Z-score of motif enrichment across β-, α-, and δ-cells. m, Venn diagram showing there are 43 overlapping upregulated genes and accessible motifs upregulated in β-cells. Dot plot are the 5 that are specific to β-cells. Source data are provided as a Source Data file.

