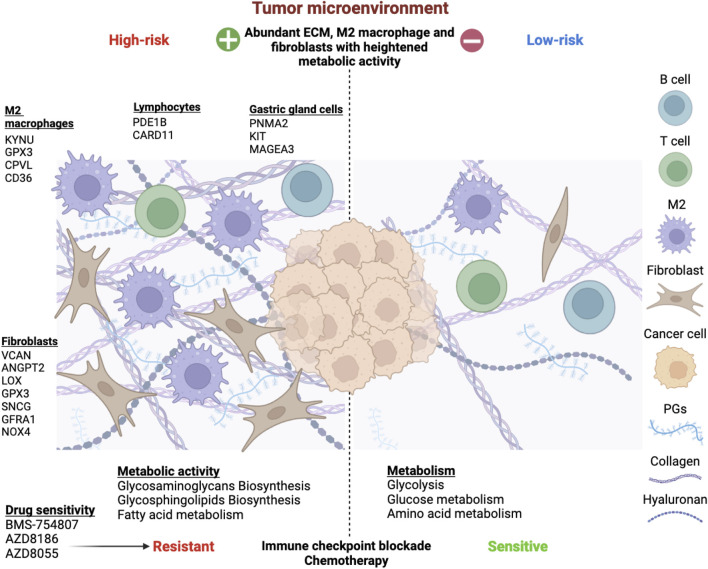
FIGURE 11.
Overview of the risk stratification of gastric cancer patients based on tumor microenvironment and metabolism interplay. Extensive analysis revealed 15 risk genes expressed by diverse TME components. M2 macrophages upregulated KYNU, GPX3, CPVL, and CD36. Fibroblasts expressed VCAN, ANGPT2, LOX, GPX3, SNCG, GFRA1, and NOX4, impacting proliferation, mesenchymal transition, angiogenesis, and ROS production. PDE1B and CARD11 were associated with B and T lymphocytes, while PNMA2, KIT, and MAGEA3 were expressed by various gastric gland cells, such as chief cells, gland mucous cells, and proliferative cells. The TME-Met Interplay upregulated ECM biosynthesis and fatty acid metabolism. The high-risk subgroup showed resistance to immunotherapy and chemotherapy but responded to three molecular targeted drugs. Conversely, low-risk patients exhibited enriched glycolysis, glucose, and amino acid metabolism, with lower ECM content and sensitivity to immunotherapy and chemotherapy.

