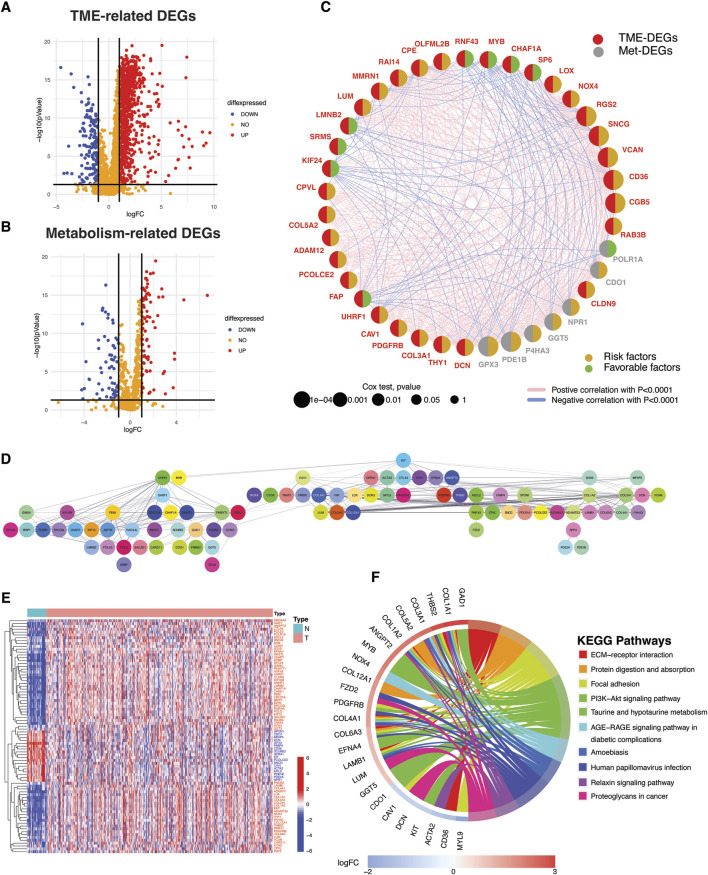
FIGURE 2.
Identification of TME- and metabolism-related DEGs with protein-level interactions and prognostic significance. (A) Volcano plots depicting TME- and (B) metabolism-related differentially expressed genes (DEGs). DEGs were defined according to the following criteria: log fold change (logFC) = 1, and the false discover rate (FDR) < 0.05. (C) Bubble Network illustrating the prognostic impact of significant TME- and metabolism-related DEGs and correlation among them. (D) Protein-protein interaction (PPI) network depicting protein-level interactions of TME-Met DEGs at interaction score = 0.4. (E) Heatmap shows the expression pattern of TME-Met DEGs between TCGA STAD normal (n = 32) and tumor samples (n = 375). Red and blue represent upregulation and downregulation respectively. (F) Circos plot depicting KEGG pathway enrichment analyses of TME-Met DEGs. (increasing depth of the red indicate the more obvious differences; q-value: the adjusted p-value).

