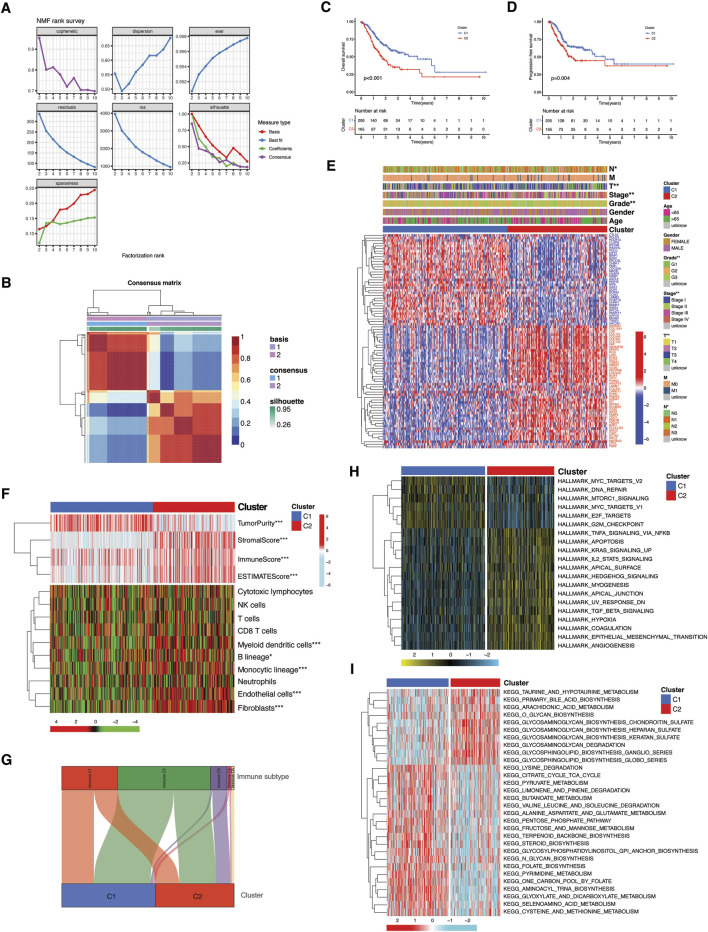
FIGURE 3.
Molecular subtyping and functional implication of TME-Met DEGs cross-talk. (A, B) Consensus clustering matrix in TCGA STAD patients. (C) Kaplan-Meier curves for the OS and (D) PFS comparison between clusters. (E) Heatmap illustrating the expression of 81 TME-Met DEGs (Red: upregulation; Blue: downregulation) between the clusters and correlation between clusters and clinicopathological features. (F) Heatmap shows the enrichment results of ESTIMATE algorithm and single-sample gene set enrichment analysis (ssGSEA) of immune cell infiltration between the clusters. p values are shown as: *p < 0.05; **p < 0.01; ***p < 0.001. (H) Sankey diagram presenting the correlation between clusters and immune subtypes. (I) Heatmaps showing GSVA enrichment scores of hallmark cancer pathways and (G) KEEG metabolic pathways in the clusters.

