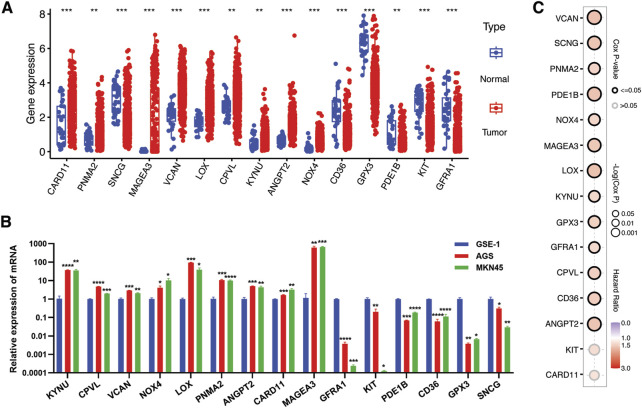
FIGURE 6.
Verification of expression of TME-Met PI genes in gastric cancer. (A) The expression levels of TME-Met PI genes between risk subgroups in the TCGA STAD cohort. (B) mRNA expression level of TME-Met PI genes in gastric normal cell (GSE-1) and cancer cells (AGS and MKN45). p values are shown as: *p < 0.05; **p < 0.01; ***p < 0.001). (C) Bubble plot depicts overall survival significance of TME-Met PI genes in TCGA STAD samples.

