FIGURE 7.
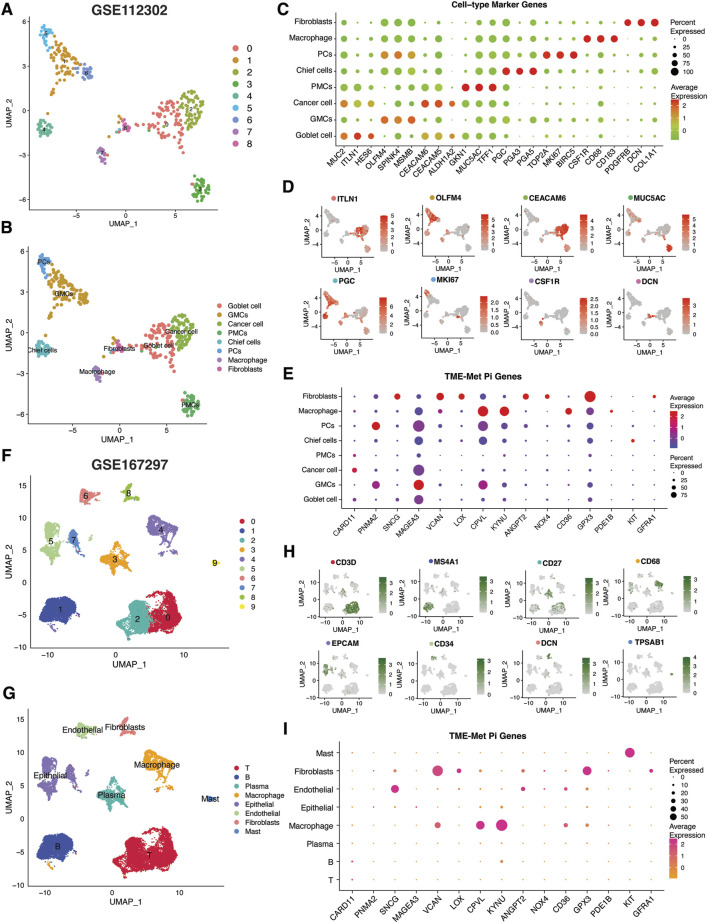
Single-cell transcriptomic analysis of TME-Met PI genes in gastric cancer. (A, B) Uniform manifold approximation and projection (UMAP) plots showing main clusters and cell-types in single-cell gastric cancer dataset (GSE112302), colored by cluster (A) and (B) cell type. (C) Bubble plot shows the expression levels of top 3 marker genes in each cell-type for GSE112302 dataset. (D) UMAP plots displaying expression patterns of cell-specific marker genes for each cell-type in GSE112302 dataset. (E) The bubble plot depicting the expression levels of TME-Met PI genes in all cell types in GSE112302 dataset. (F, G) UMAP plots showing main clusters and cell-types in single-cell gastric cancer dataset (GSE167297), colored by cluster (F) and (G) cell type. (H) UMAP plots displaying expression patterns of cell-specific marker genes for each cell-type in GSE167297 dataset. (I) The bubble plot depicting the expression levels of TME-Met PI genes in all cell types in GSE167297 dataset.

