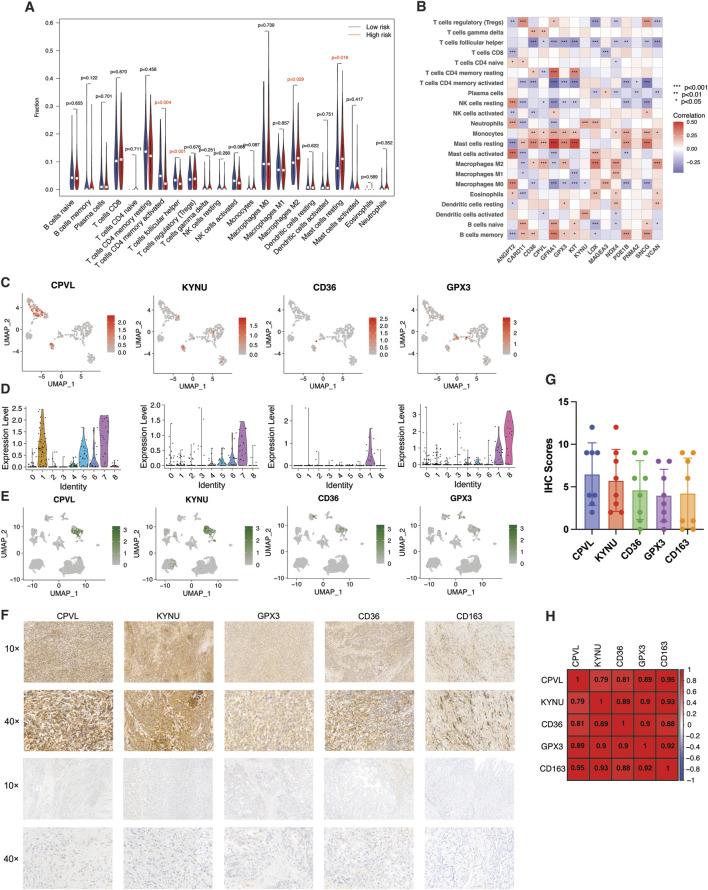
FIGURE 8.
Identification and validation of M2 macrophage-related risk genes. (A) Violin plot of abundance of 22 subtypes of immune cells in risk subgroups. (B) Spearman’s correlation between infiltration of 22 subtypes of immune cells and individual TME-Met PI genes (n = 15) in TCGA STAD cohort. p values are shown as: *p < 0.05; **p < 0.01; ***p < 0.001. (C) UMAP plots and (D) Violin plots showing expression patterns of CPVL, KYNU, CD36, and GPX3 in single-cell gastric cancer dataset (GSE112302). (E) UMAP plots showing expression patterns of CPVL, KYNU, CD36, and GPX3 in GSE167297 dataset. (F) Representative images of expression (brown, cell cytoplasmic/nucleus stain) and ( G ) IHC quantification of expression level of CPVL, KYNU, CD36, and GPX3 and marker of M2 macrophage (CD163) in the clinical samples of stomach adenocarcinoma (n = 8). ( H ) Pearson’s correlation of expression level of CPVL, KYNU, CD36, and GPX3 and marker of M2 macrophage (CD163) in the clinical samples of stomach adenocarcinoma.

