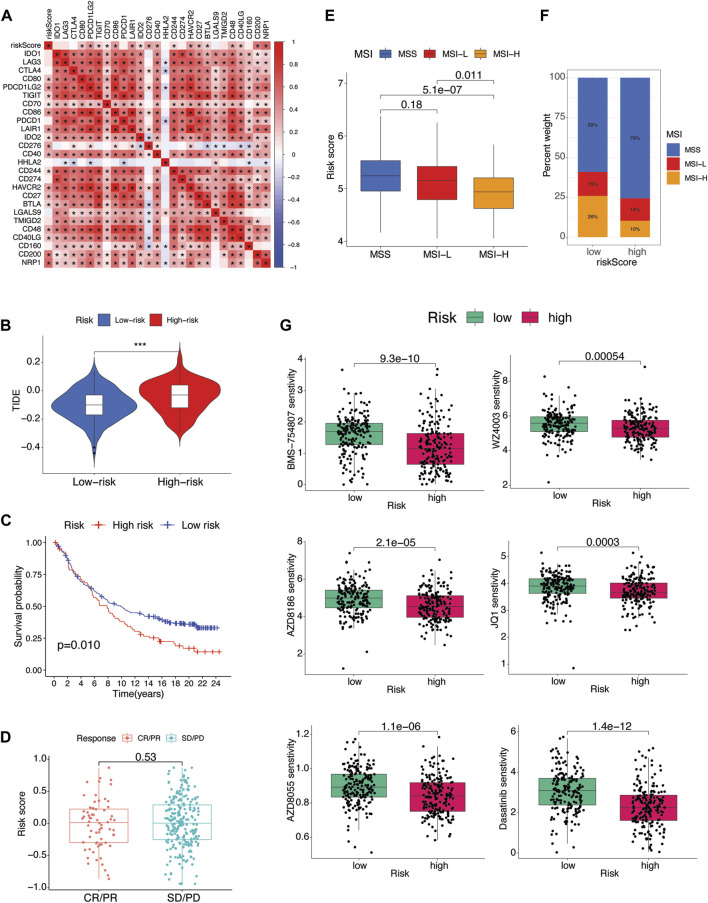
FIGURE 9.
Therapeutic implications (A) Pearson’s correlation between riskScore and several immune checkpoint inhibitors. p values are shown as: *p < 0.05; **p < 0.01; ***p < 0.001. (B) Association between riskScore and TIDE score of TCGA STAD patients. (C) The Kaplan-Meier curves of difference in survival probability between risk subgroups and (D) boxplots of riskScore variation in responsiveness to immune checkpoint blockade of IMvigor210 urothelial carcinoma cohort. (E) Box plot of association of microsatellite instability (MSI) and riskScore. (F) Percent of MSI types in each risk subgroup. (G) Drug sensitivity analysis of risk subgroups.

