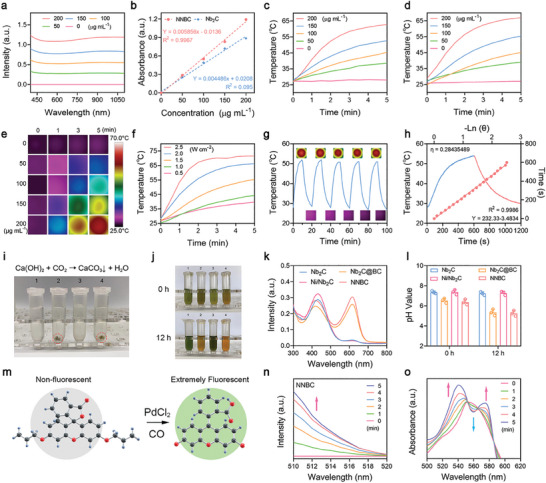
Figure 2.

Photothermal‐conversion and CO generation capability of NNBCs. a) Ultraviolet‐visible (UV–vis)‐NIR absorption spectra of NNBCs at various concentrations. b) Molar absorption coefficients of few‐layer Nb2C and NNBCs. c,d) Photothermal curves of c) few‐layer Nb2Cs and d) NNBCs under 1064 nm laser irradiation. e) The thermal images of different concentrations of NNBCs under 1064 nm laser irradiation. f) Photothermal curves of NNBCs under irradiation by a NIR laser at diverse power densities. g) Heating curve of 5 on/off cycles of NNBCs under 1064 nm laser irradiation. h) Photothermal‐conversion curve of NNBCs under 1064 nm laser exposure and the corresponding linear relationship between the cooling duration and logarithm of the temperature change. i) Photographs of various mixtures after 1064 nm laser illumination and addition of Ca (OH)2. j) Photographs of various mixtures after 1064 nm laser irradiation and addition of BTB solution for 0 h (up) and 12 h (down). k) The corresponding UV–vis absorption spectra of i) (1: Nb2C; 2: Nb2C@BC; 3: Ni/Nb2C; 4: NNBCs). l) pH levels of the supernatant after various treatments for 0 and 12 h (n = 3). Data are presented as mean ± SD. m) Schematic illustration of fluorescent detection of CO with a CO probe. n) Fluorescent spectra changes of NNBCs together with CO probe and PdCl2 under 1064 nm laser irradiation. o) CO release from NNBCs as measured by myoglobin assay.
