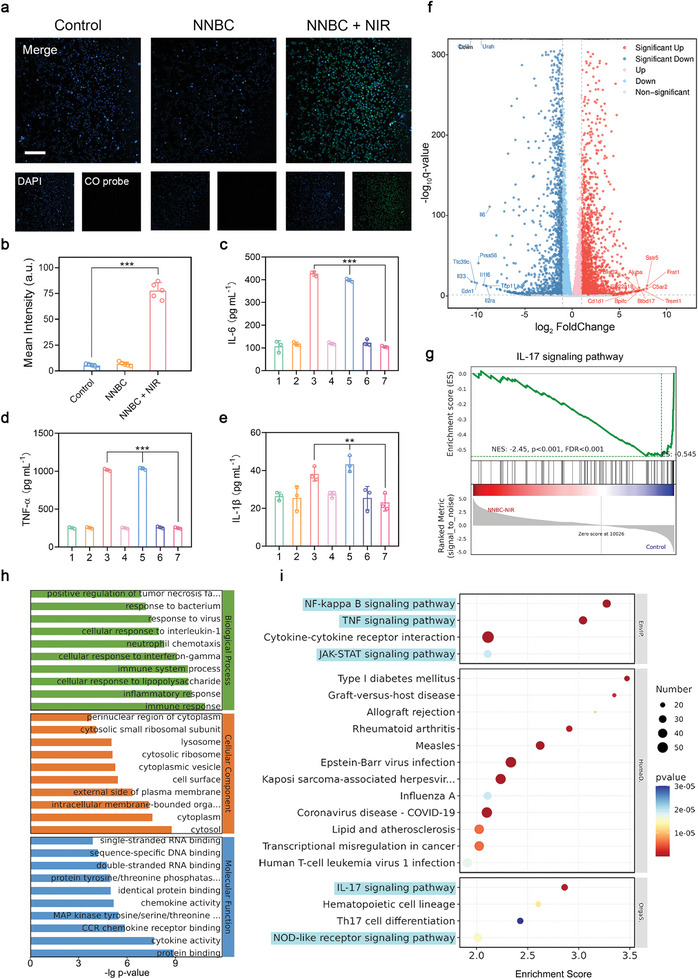
Figure 4.

Potential mechanisms of the anti‐inflammatory performance of NNBCs under 1064 nm laser irradiation by transcriptome high throughput sequencing analysis. a) Fluorescence images of CO in RAW 264.7 macrophages after various treatments (blue and green fluorescence: RAW 264.7 macrophages stained by DAPI and CO fluorescent probe, respectively; scale bar = 100 µm) and b) the corresponding semi‐quantitative analysis of the green fluorescence intensities (n = 5). c) IL‐6, d) TNF‐α, and e) IL‐1β levels of RAW 264.7 macrophages from diverse treatment groups (1: control; 2: Nb2C; 3: Nb2C + NIR; 4: Ni/Nb2C; 5: Ni/Nb2C + NIR; 6: NNBC; 7: NNBC + NIR; n = 3). f) Comparative volcano plots illustrating the up‐regulated (red) and down‐regulated (blue) genes (cut‐off logarithm 10 (fold change) ≥2.0) of RAW 264.7 cells between the NNBC + NIR and control groups by RNA‐Seq analysis. g) Topological graph of the “IL‐17 signaling pathway” mediated by NNBC + NIR in the Reactome data. h,i) Enrichment analysis of h) GO and i) KEGG from the differential expression of genes in NNBC + NIR treated RAW 264.7 cells compared to the control ones (cut‐off logarithm10 (fold change) ≥2.0). All data are presented as the mean ± SD, *p < 0.05, **p < 0.01, ***p < 0.001.
