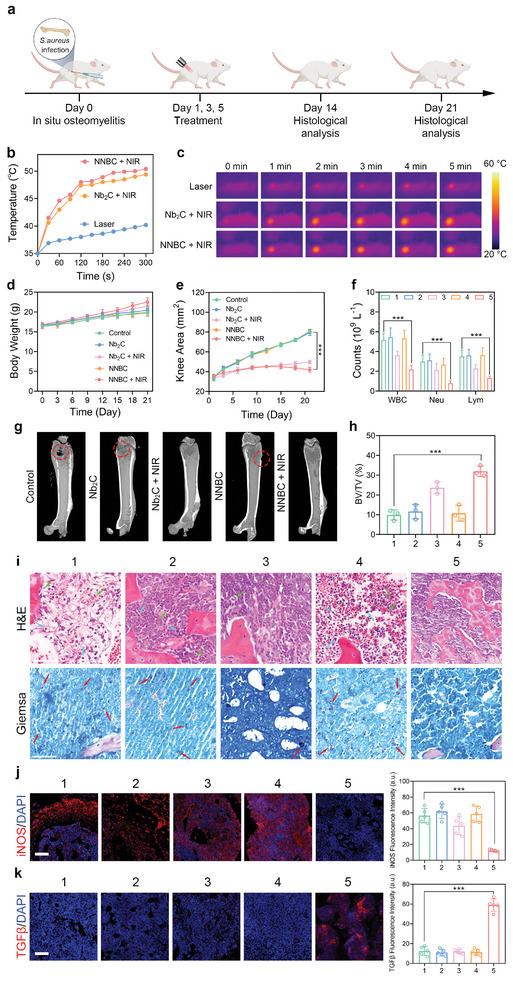
Figure 6.

Treatment of osteomyelitis with NNBCs in vivo. a) Schematic illustration of the in situ osteomyelitis model establishment and treatment process. b) Photothermal heating curves, and c) the corresponding thermographic images from different treatment groups. d) Body weights of the mice, e) the average knee areas of the infected knees, and the f) blood parameters, including WBC, Neu and Lym, from various treatment groups (n = 5). g) Mircocomputed tomography (MCT) images, and h) the corresponding bone volume/total volume (BV/TV) results of the infected legs (n = 3). i) H&E and Gimesa staining of the infected bone tissue (Green arrow: Neu; Blue arrow: Lym; Red arrow: bacteria). j) iNOS and k) TGF‐β immunofluorescence staining of the infected bone tissue and the corresponding semi‐quantitative analysis (1: control; 2: Nb2C; 3: Nb2C + NIR; 4: NNBC; 5: NNBC + NIR; scale bar = 50 µm; n = 5). All data are presented as the mean ± SD, *p < 0.05, **p < 0.01, ***p < 0.001.
