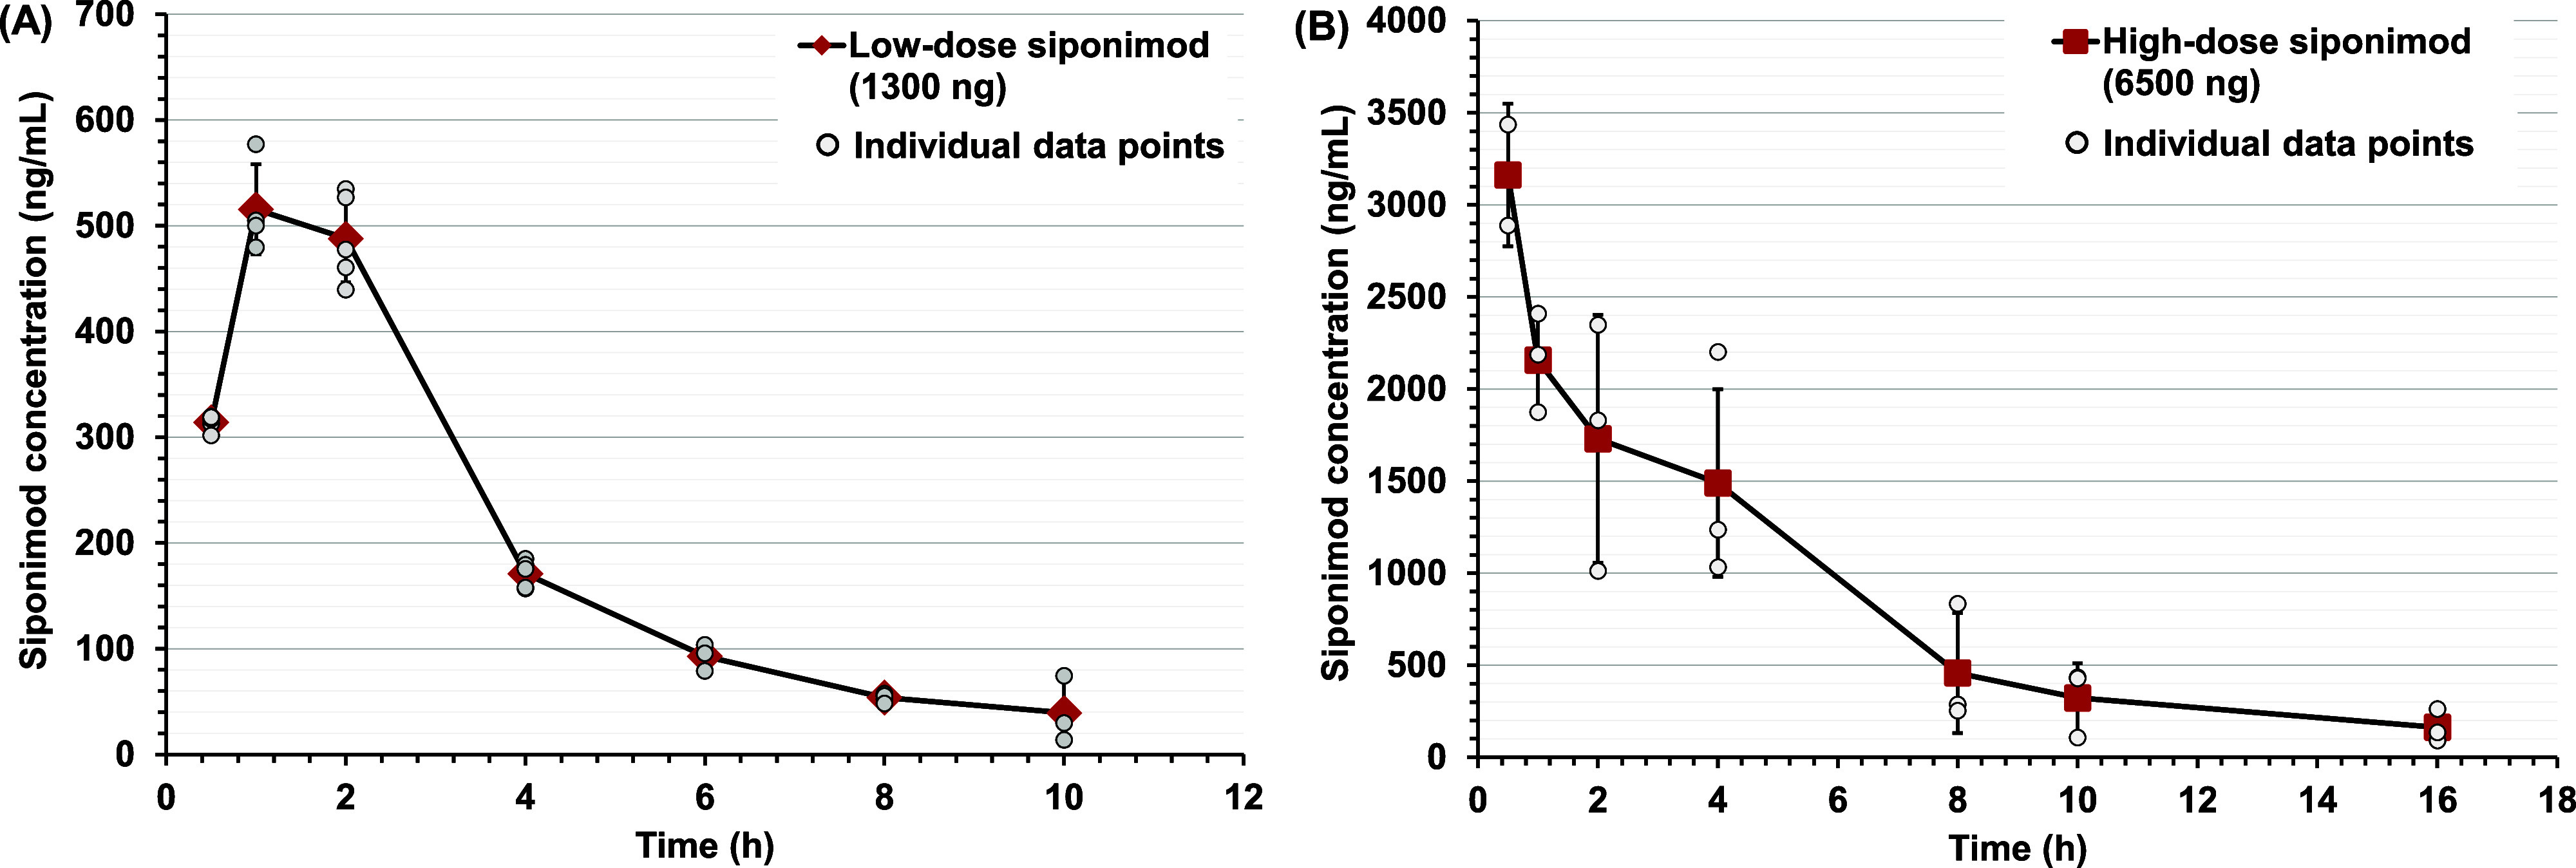
Figure 1.

Siponimod concentration (ng/mL) measured in the vitreous of albino rabbits at different time points after intravitreal injection of (A) low-dose (1300 ng) and (B) high-dose siponimod (6500 ng). Data are presented as mean ± standard deviation of the observed values (large red symbols), with small circles showing siponimod concentration obtained from each rabbit, n = 2–5 rabbits at each time point.
