Figure 6.

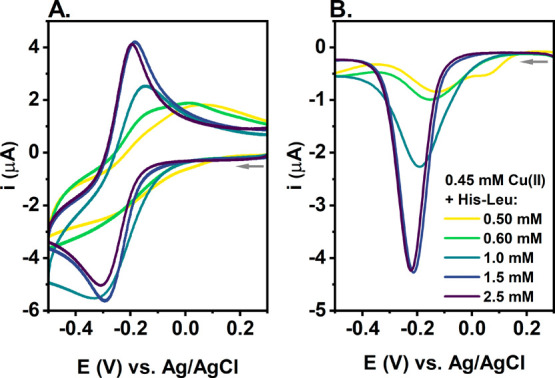
(A) CV and (B) DPV curves of Cu(II) reduction for 0.45 mM Cu(NO3)2 and 0.50, 0.60, 1.0, 1.5, and 2.5 mM His-Leu in 0.1 M KNO3 (pH 7.4). The arrows represent the direction of the potential change.

(A) CV and (B) DPV curves of Cu(II) reduction for 0.45 mM Cu(NO3)2 and 0.50, 0.60, 1.0, 1.5, and 2.5 mM His-Leu in 0.1 M KNO3 (pH 7.4). The arrows represent the direction of the potential change.