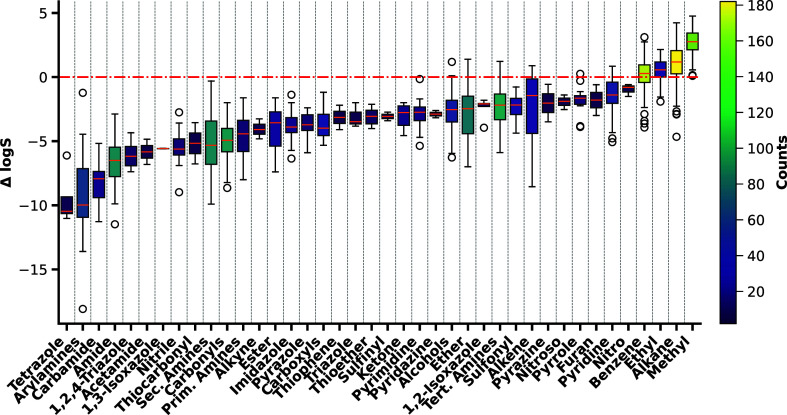
Figure 4.
Boxplot depicting the average normalized contributions to solubility per functional group. The box spans from the first to the third quartile, with a median line, and whiskers that extend 1.5 times the interquartile range. The observed high variability may be due to electron delocalization and contrasting contributions from overlapping atomic environments. Only functional groups appearing in two or more molecules were included in the analysis.

