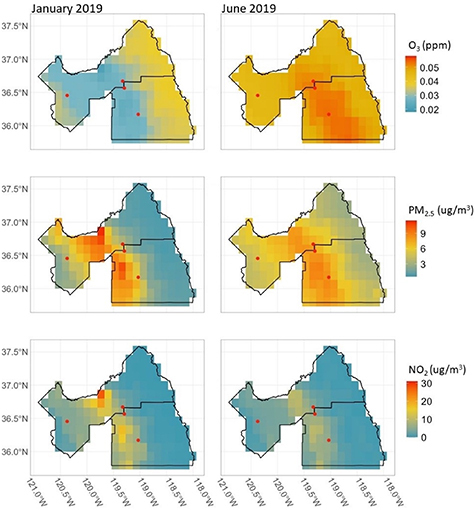
Figure 1.

Spatial variation in the concentrations of O3, PM2.5, and NO2 in Fresno and Tulare Counties in January and June 2019, shown as the monthly averages based on NAAQS daily standards, as rasterized values estimated from the CMAQ model. Red points represent study community locations.
