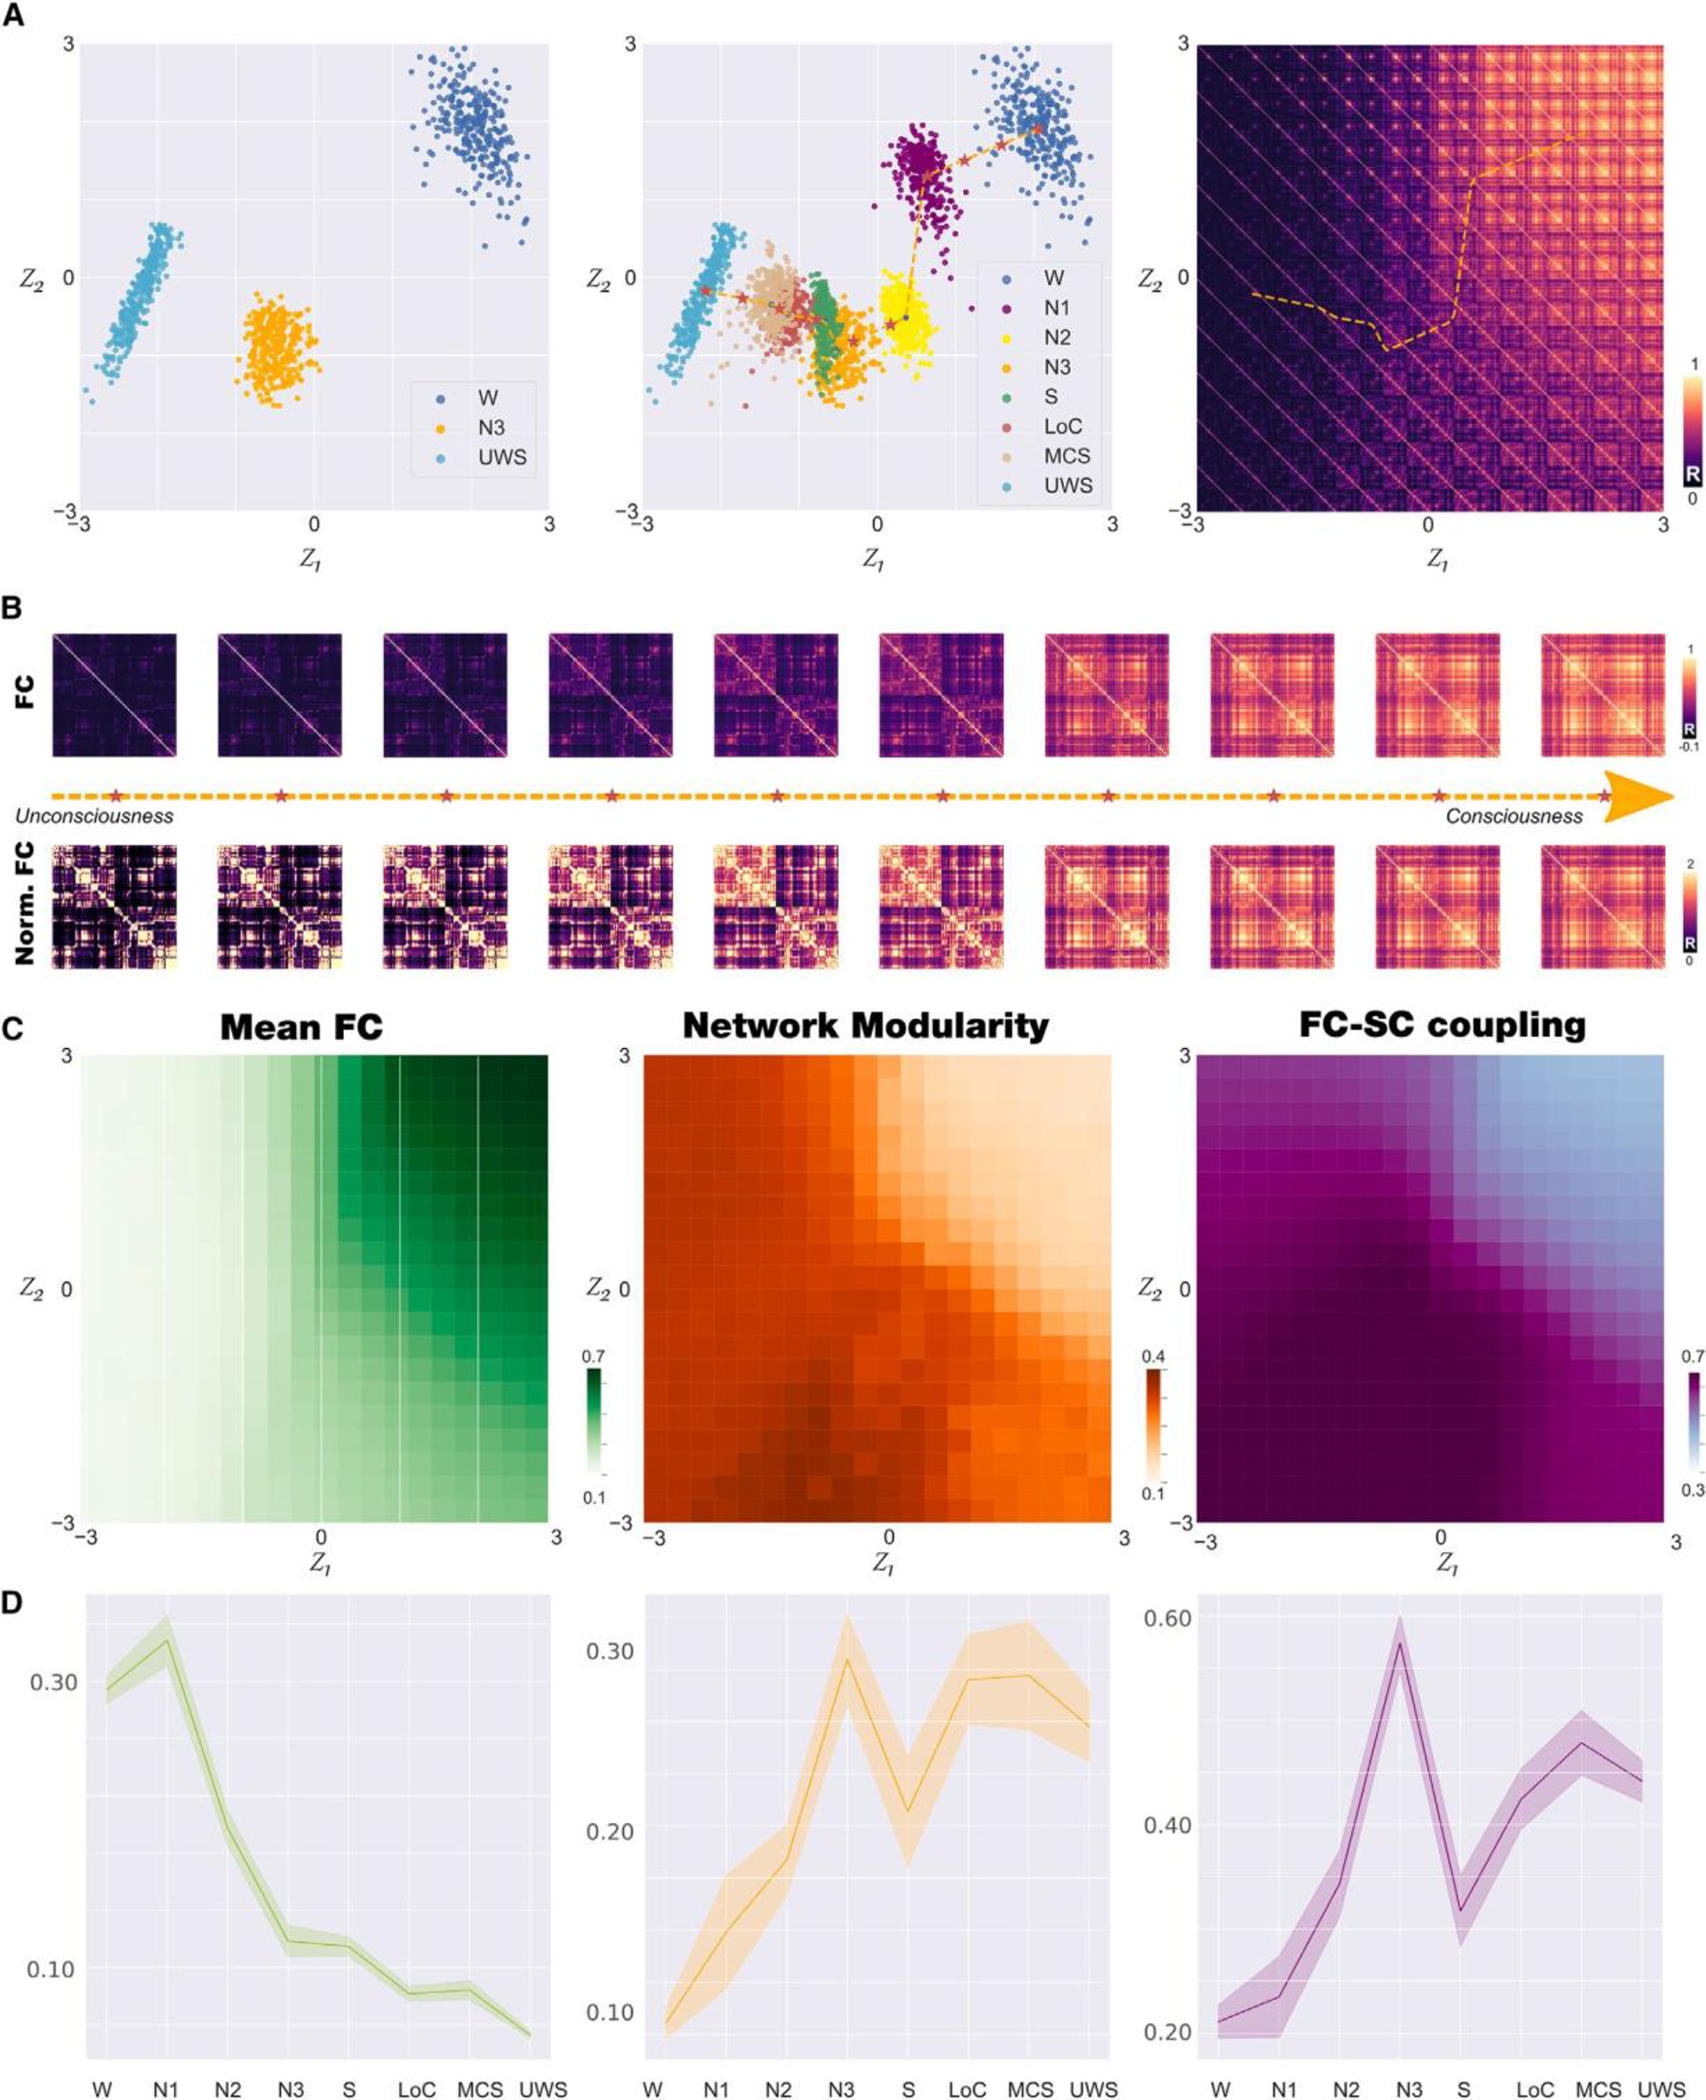
Figure 2. Latent space encoding of whole-brain FC reflects loss of consciousness alongside a low-dimensional trajectory.

(A) We trained the VAE using simulated FC matrices corresponding to states W, N3, and UWS (left panel). We then applied the trained autoencoder to FC matrices corresponding to all other brain states, obtaining clusters of points organized alongside a low-dimensional trajectory (dashed line) representing progressive loss (legend continued on next page) of consciousness (middle panel). Applying the decoder to the latent space coordinates, we illustrate the FC matrices corresponding to each part of the latent space, including those included in the trajectory (right panel).
(B) FC matrices sampled homogeneously along the trajectory identified in (A), middle (indicated with red stars), both for matrices with (up) and without (bottom) normalization.
(C) Characterization of the latent space in terms of mean FC (left panel), network modularity (middle panel), and SC-FC coupling (right panel).
(D) Mean FC (left panel), network modularity (middle panel), and SC-FC coupling (right panel) for the 300 encoded FC matrices corresponding to each brain state(mean ± SD) (W, wakefulness; N1, N2, and N3, stages from light to deep sleep; S, sedation; LOC, loss of consciousness; MCS, minimally conscious state; UWS, unresponsive wakefulness syndrome).
