
Figure 3. Perturbational analysis of stability and reversibility of brain states.
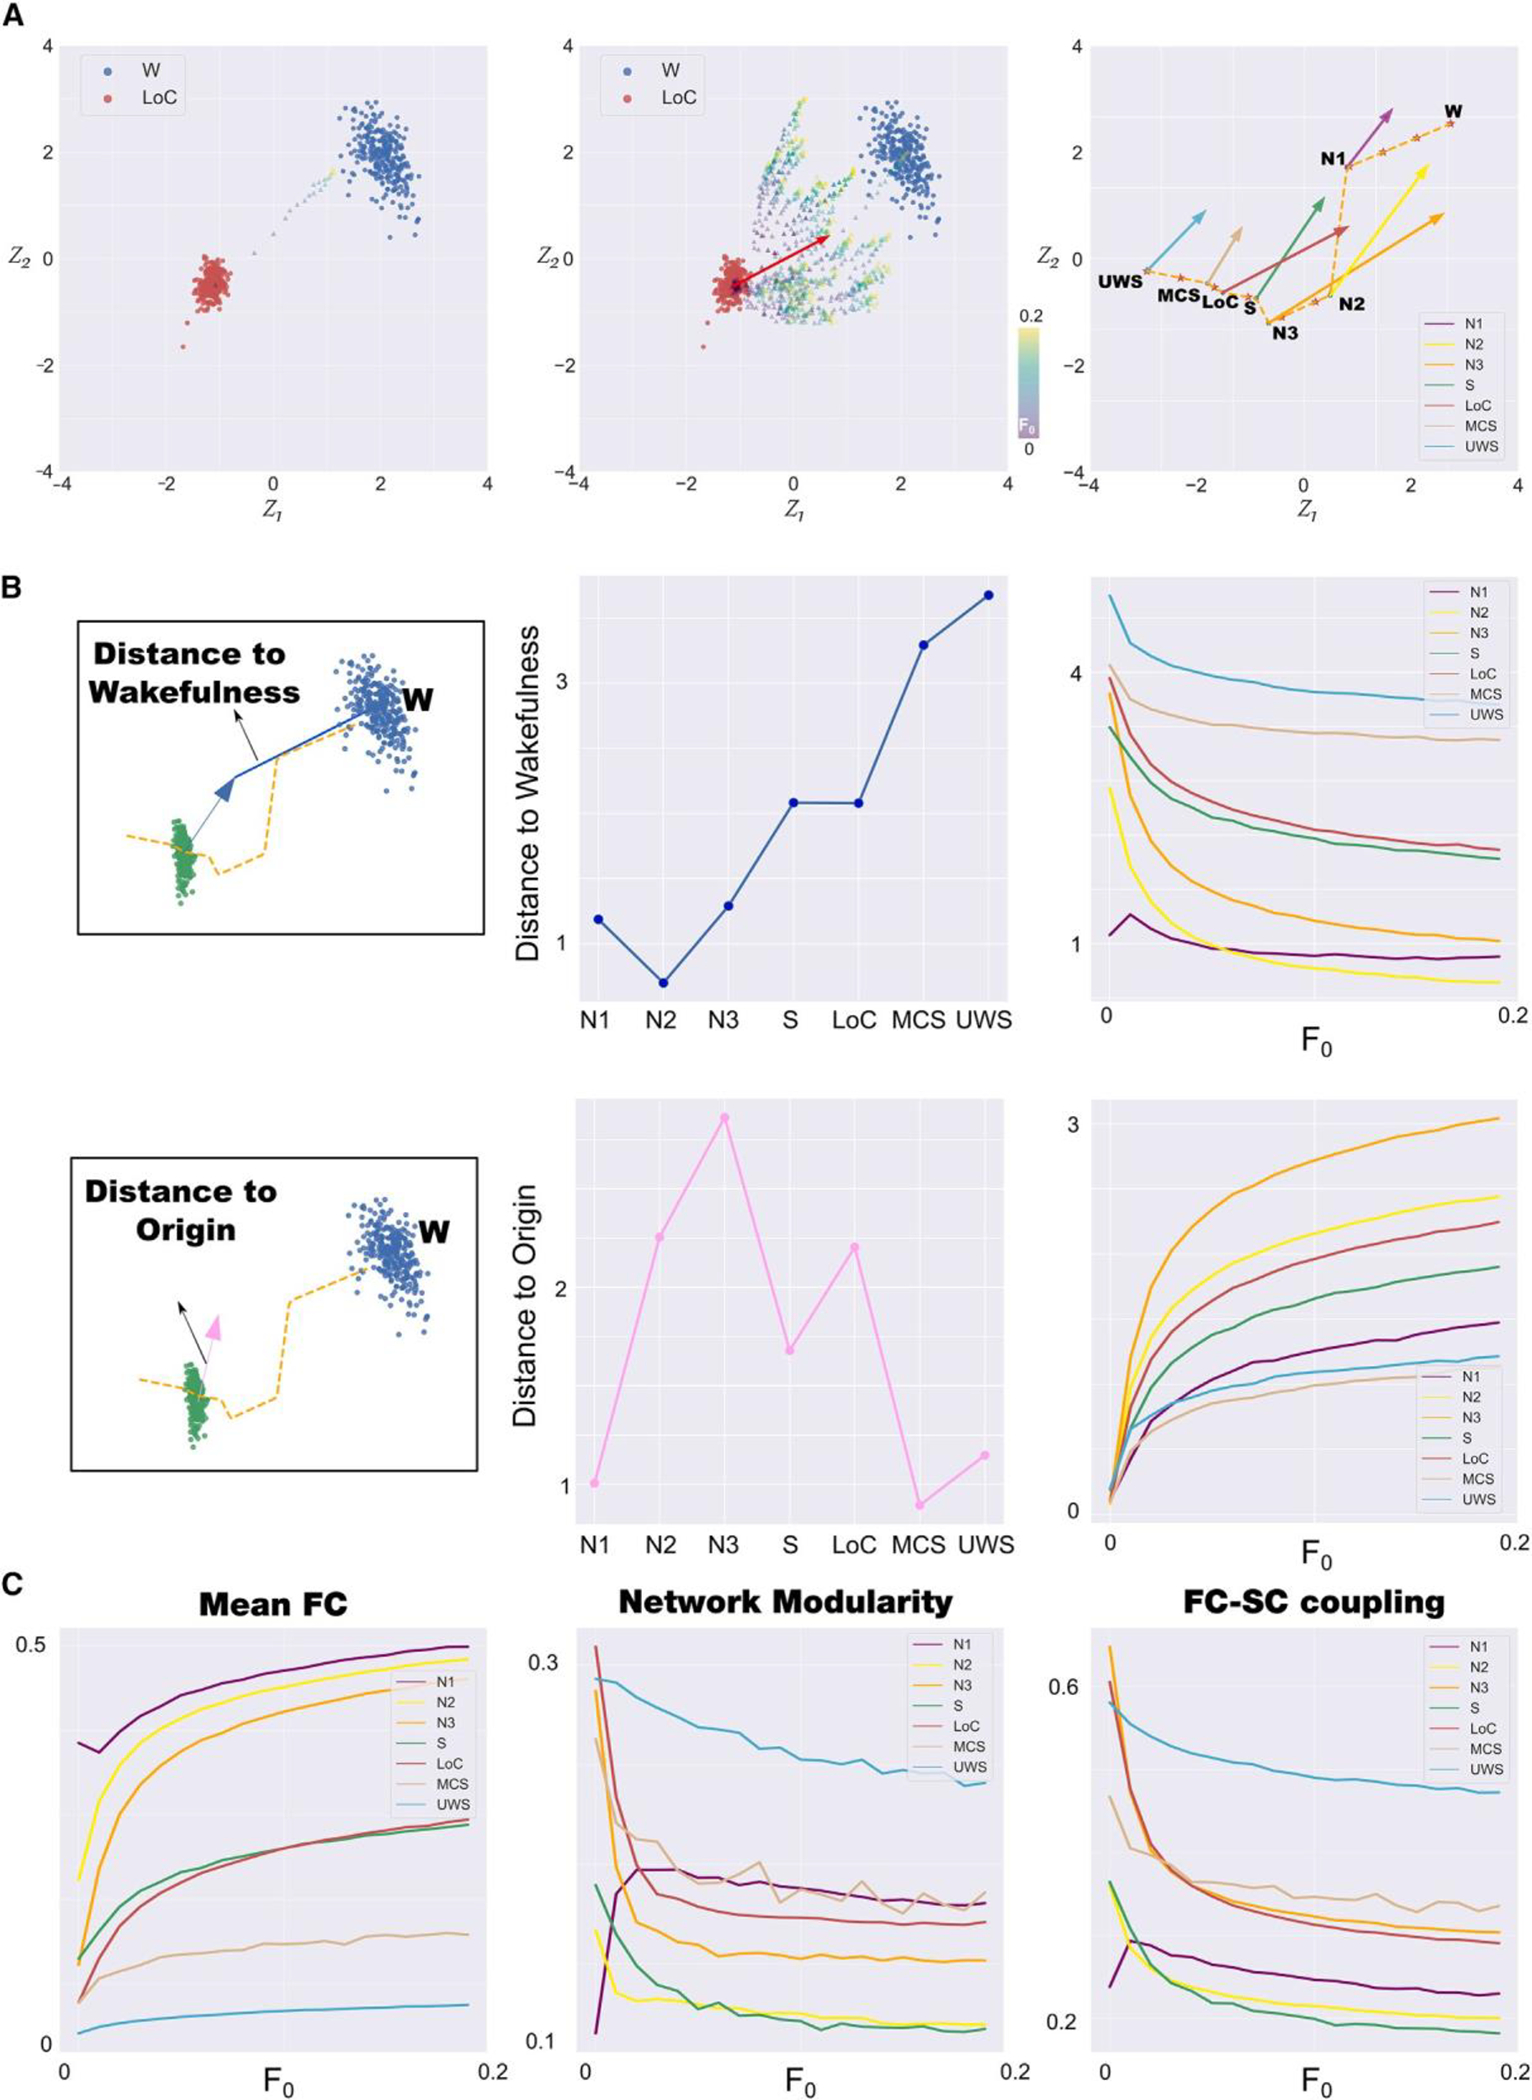
(A) Left panel: example trajectory obtained by encoding in latent space the outcome of introducing periodic forcing in the model at a single pair of homotopic regions. Middle panel: same as in the left panel but showing trajectories corresponding to all pairs of homotopic regions. Right panel: average maximal displacements for all brain states represented in the latent space.
(B) Left panel: geometric definitions of distance to wakefulness and distance to origin. Middle panel: the two metrics defined in the left panel for all brain states.
Right panel: parametric behavior of these metrics per brain state as a function of the forcing amplitude.
(C) Mean FC (left panel), modularity (middle panel), and SC-FC coupling (right panel) for each state as a function of the perturbation strength (W, wakefulness; N1,N2, and N3, stages from light to deep sleep; S, sedation; LOC, loss of consciousness; MCS, minimally conscious state; UWS, unresponsive wakefulness syndrome).