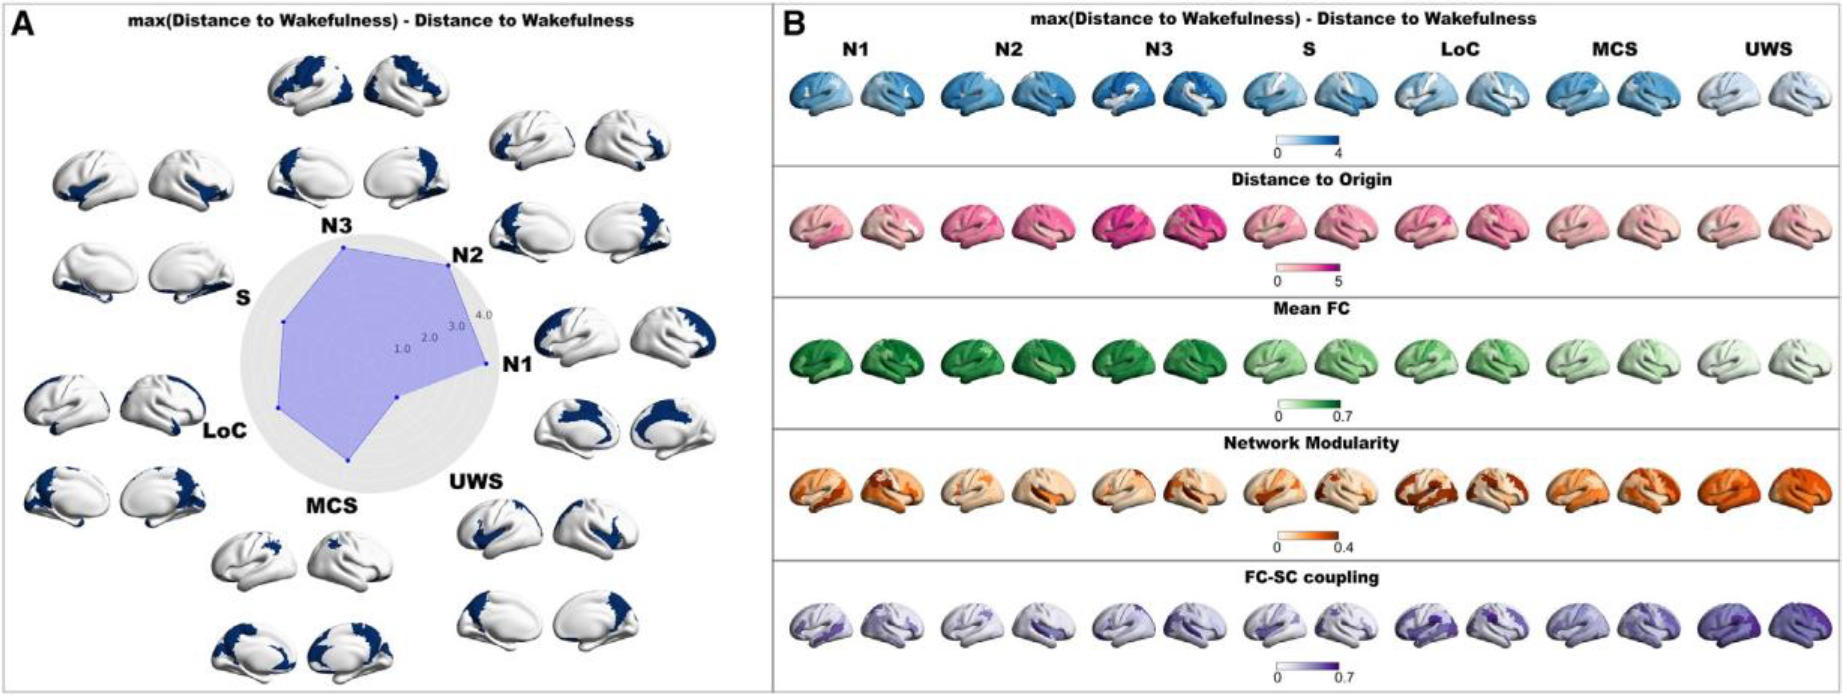
Figure 4. Neuroanatomical representation of the response to external stimulation.

(A) The top 20% in terms of distance to wakefulness are rendered in brains for each investigated state of consciousness. The mean values across the top 20% are represented in the radar plot. Importantly, we represent the maximum value across brain regions minus the single value region to obtain a metric that increases when the transition toward wakefulness is better.
(B) We extend the analysis to the other proposed metrics in latent space. Each row corresponds to a different metric. Columns contain three-dimensional renderings where the regions are colored depending on how the corresponding metric behaves asymptotically with the perturbation strength when applied to that region pair (W, wakefulness; N1, N2, and N3, stages from light to deep sleep; S, sedation; LOC, loss of consciousness; MCS, minimally conscious state; UWS, unresponsive wakefulness syndrome).
