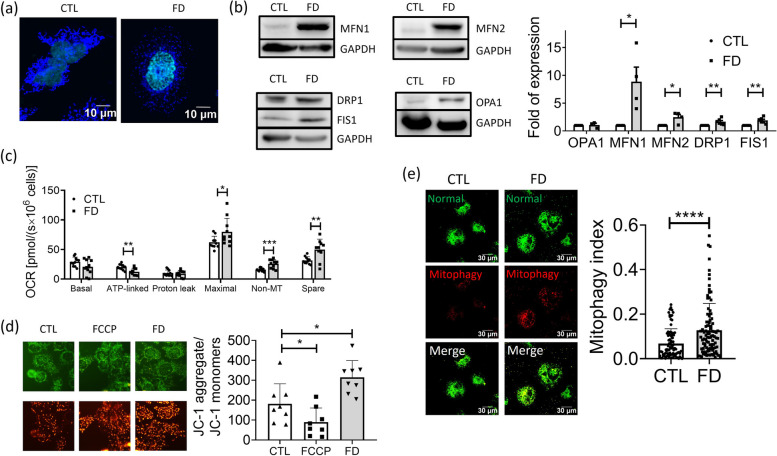
Fig. 6.
Disturbed mitochondrial activity and distribution were found in FD Huh7 cells. Huh7 cells cultivated in FD medium for 5 days were stained with MitoTracker for mitochondrial morphology (a) and subjected to Western blotting for characterizing the expression of mitochondrial fusion-fission proteins (b). Significant increase was found for both fusion (MFN1 and MFN2) and fission (DRP1 and FIS1) proteins, suggesting an increased mitochondrial dynamic in FD cells. Data were collected from at least 4 independent experiments. c Huh7 cells cultivated in CTL or FD medium for 8 to 9 days were subjected to Oroboros O2k for monitoring mitochondrial activity. Lowered ATP production and elevated non-mitochondria OCR and spare capacity were observed in Huh7 cells. Presented are data collected from at least 9 independent experiments. d Cells cultivated in CTL or FD medium for 8 days were stained with JC-1 (5,5',6,6'-tetrachloro-1,1',3,3'-tetraethylbenzimidazolylcarbocyanine iodide) for assessing mitochondrial membrane potential (MMP) changes. The increased ratio between aggregated and monomer mitochondria indicates a higher mitochondrial membrane potential in FD cells. Presented are data collected from at least 8 independent experiments (e) Huh7 cells were transfected with mt-Keima, a ratio-metric pH-sensitive fluorescent probe targeting the mitochondrial matrix, at 7 dps. In a neutral environment, mt-Keima predominantly emits a short wavelength (normal, 440 nm), displaying a green mitochondrial signal. Conversely, in an acidic environment, it primarily emits a long wavelength (mitophagy, 586 nm), generating a red lysosomal signal. The 'Mitophagy Index' was determined by calculating the ratio of 586 nm/ 440 nm fluorescence signals in Huh7 cells. Data were collected from at least 3 independent experiments with the total sample number of 90-97 for each group. Statistical data are shown in mean ± SEM. CTL, control (cells without FD); FD, folate deficiency. FCCP, carbonylcyanide-p-trifluoromethoxyphenylhydrazone (a potent uncoupler of oxidative phosphorylation). Statistical data are shown in mean ± SEM. * p<0.05, **, p <0.01, ****, p<0.0001

