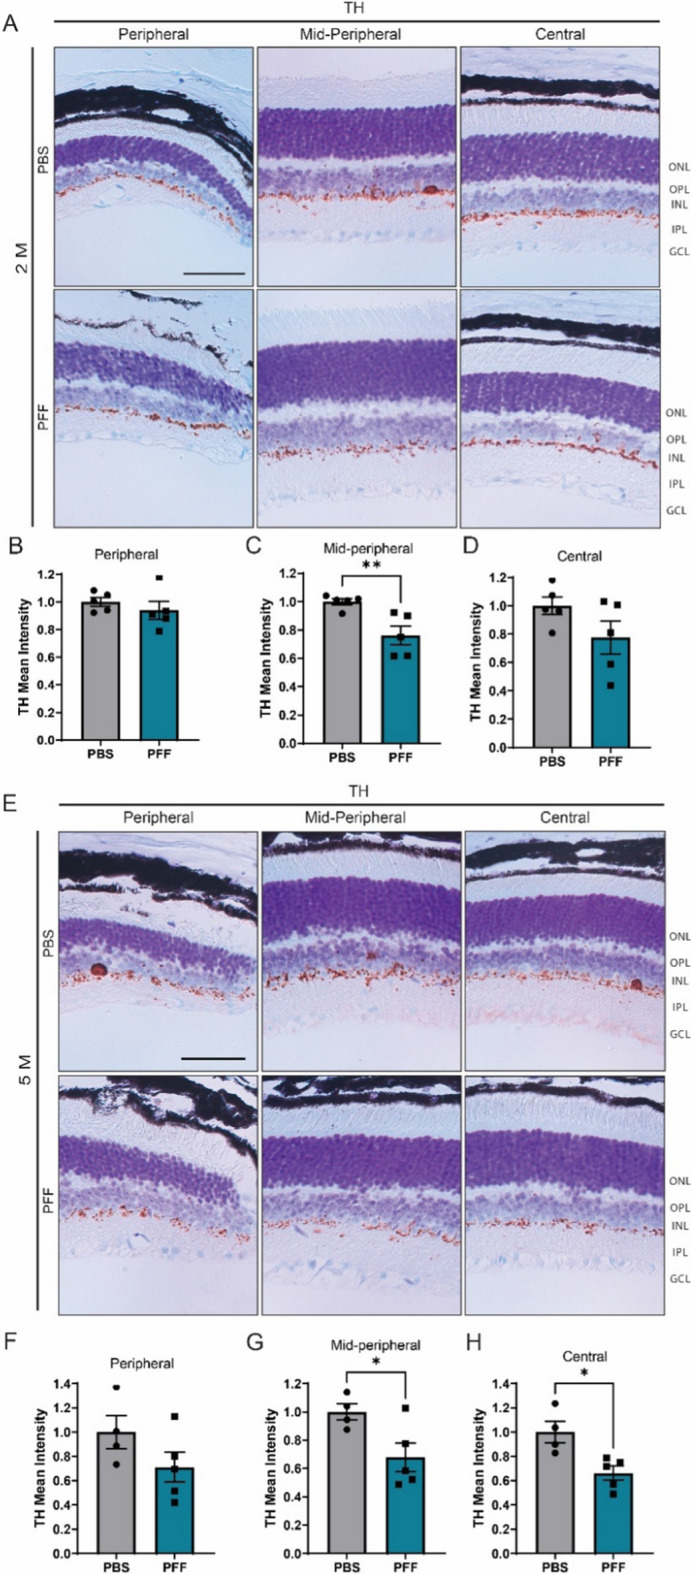
Fig. 5.

Intravitreal injection of PFFs leads to a decrease in TH levels in the central and midperipheral retina. A, D Representative images of TH immunostaining in the retina at 2 months (A) and 5 months (E) after injection. B–D, F–H Quantification of the intensity of TH immunoreactivity in the border between the INL and IPL from the peripheral, midperipheral and central retina at 2 (B–D) and 5 months (F–H) post injection. Scale bar: 50 µm. Data are expressed as means ± s.e.m, relative to control (PBS, n = 5 mice, PFF n = 5 mice; *p < 0.05, **p < 0.01, ***p < 0.001; Student’s t-test)
