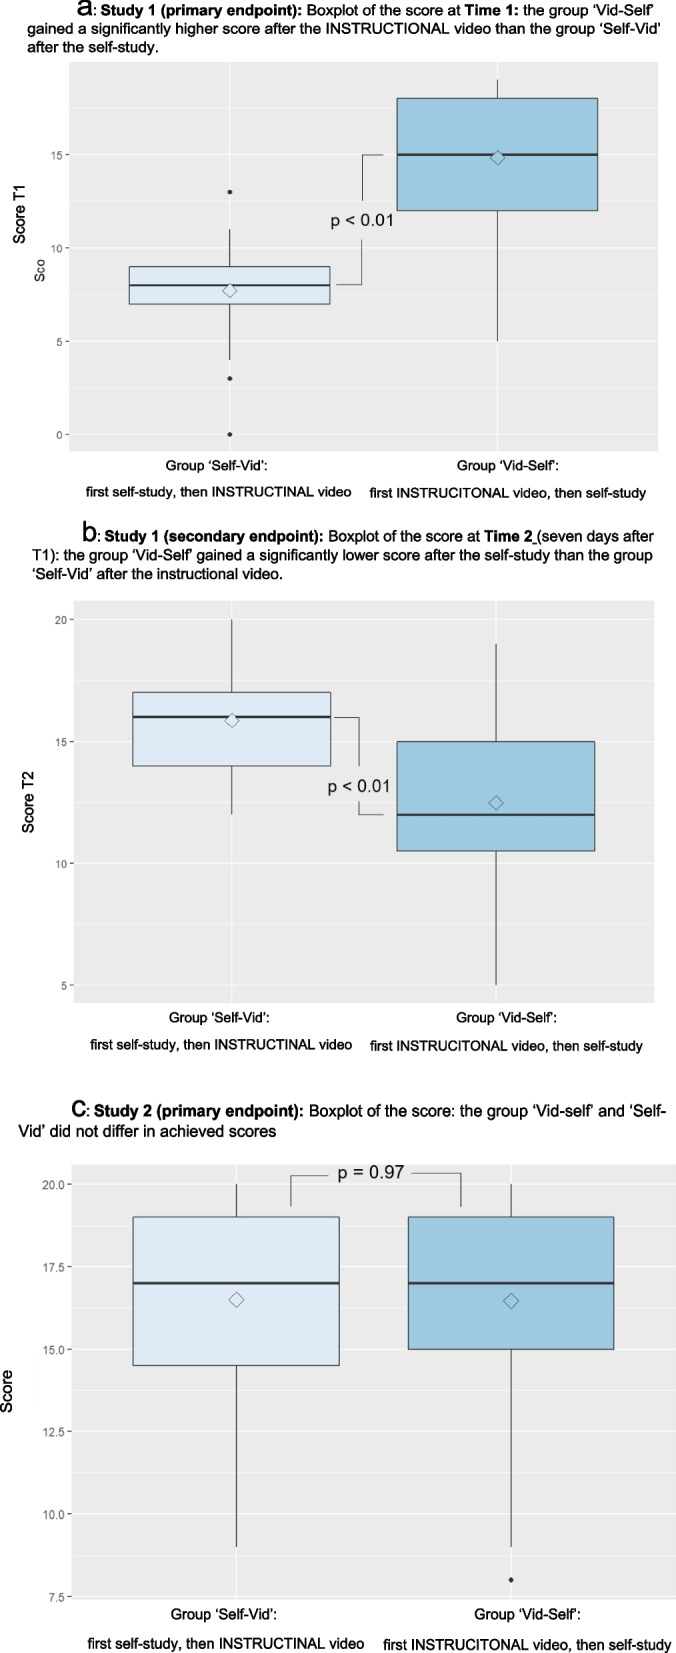
Fig. 2.

Boxplot of the scores of Study 1 and Study 2. These boxplots display the scores of the two groups on the abscissa: The Self-Vid group and the Vid-Self group. The ordinate shows the score with a minimum of 0 and a maximum of 20. The horizontal thick lines indicate the median, the thin lines indicate the first and third quartiles, and the vertical bars indicate the minimum and maximum scores. The dots indicate extreme values, and the rhombs indicate the means of the scores. a Boxplot of the scores in Study 1 at T1. Study 1 (primary endpoint): Boxplot of the score at Time 1: The ‘Vid-Self’ group obtained a significantly greater score after the INSTRUCTIONAL video than did the ‘Self-Vid’ group after the self-study. (primary endpoint of Study 1: p < 0.01). b Boxplot of the scores in Study 1 at T2. Study 1 (secondary endpoint): Boxplot of the score at Time 2 (seven days after T1): The ‘Vid-Self’ group had a significantly lower score after the self-study than did the ‘Self-Vid’ group after the instructional video (secondary endpoint of Study 1: p < 0.01). c Boxplot of the scores in Study 2. Study 2 (primary endpoint): Boxplot of the score: The ‘Vid-self’ and ‘Self-Vid’ groups did not differ in terms of the achieved scores (p = 0.97)
