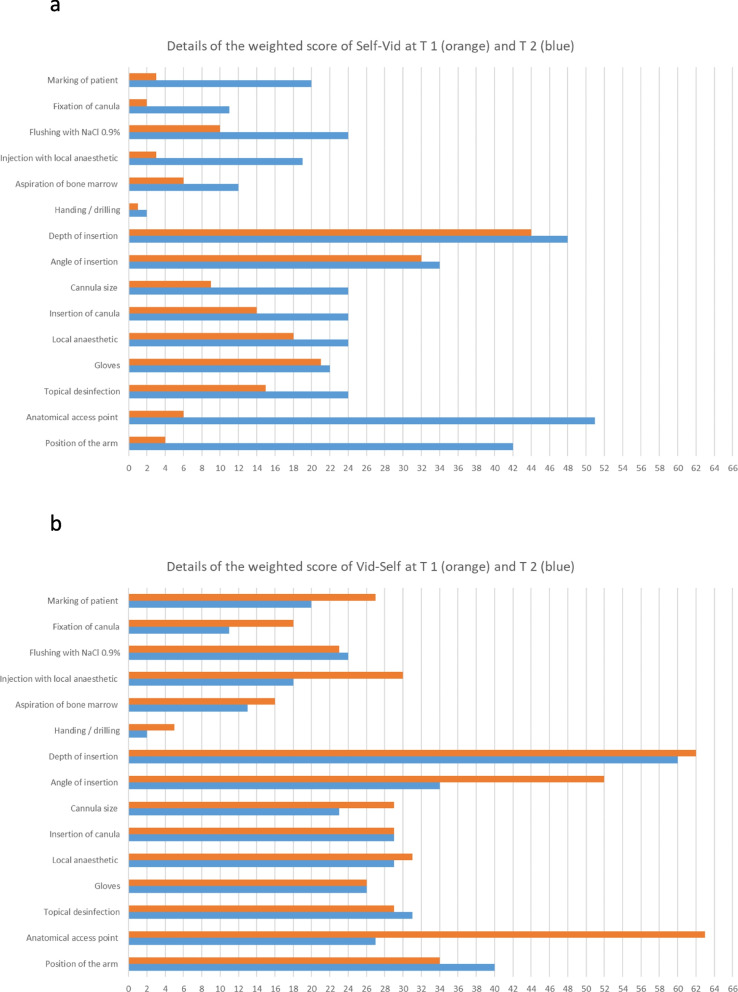
Fig. 3.
Details of the weighted scores of participants in Study 1. a The diagram contains the data of participants of the Vid-Self group in Study 1 who performed the tests at both points in time (n = 31). For those participants, the diagram displays the sum of the single items of the score with respect to their weighting, as described in the “Methods” section. The values of the single items were weighted from 1 to 3 concerning the maximum number of achievable points according to their impact on clinical relevance (additional file 1). For example, the maximum score for the item “Anatomical access point” was 3 points, so for 31 participants it was were equivalent to 93 points. The points in time are displayed as follows. T 1: orange, T 2: blue. b The diagram contains data from participants of the Self-Vid group in Study 1 who performed the test at both points in time (n = 24)

